S&P 500 Net Leverage
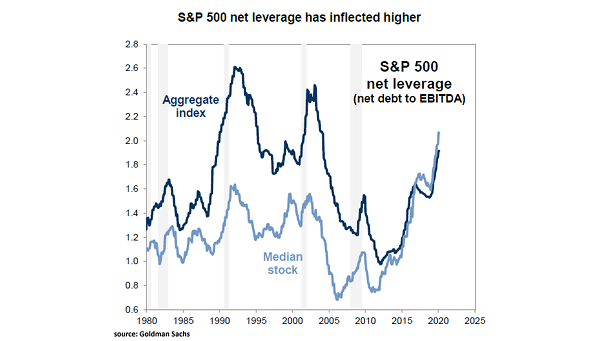
S&P 500 Net Leverage S&P 500 net leverage has gone up. Image: Goldman Sachs Global Investment Research
S&P 500 Net Leverage S&P 500 net leverage has gone up. Image: Goldman Sachs Global Investment Research
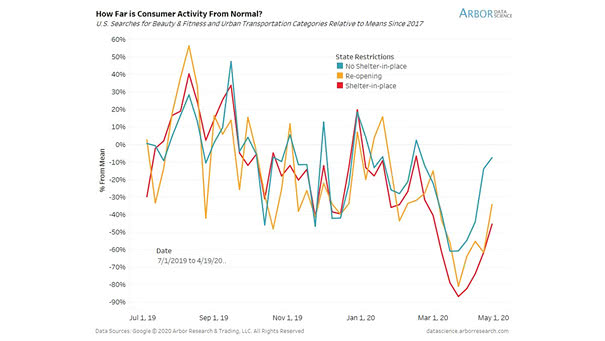
How Far is U.S. Consumer Activity From Normal? U.S. searches for beauty & fitness and urban transport suggest consumers are returning. Image: Arbor Research & Trading LLC
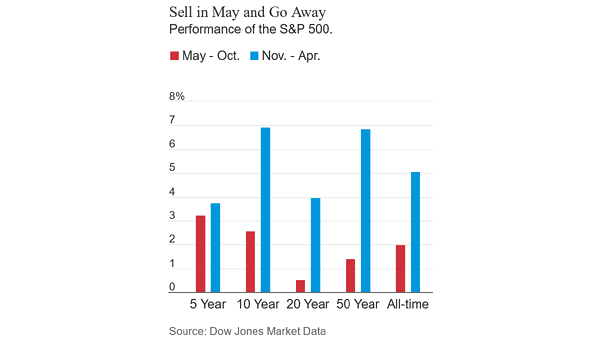
Sell in May and Go Away – Performance of the S&P 500 The next 6 months have been the worst on average, but the S&P 500 has been higher 7 of the past 8 years during the May to October period. Image: Barron’s
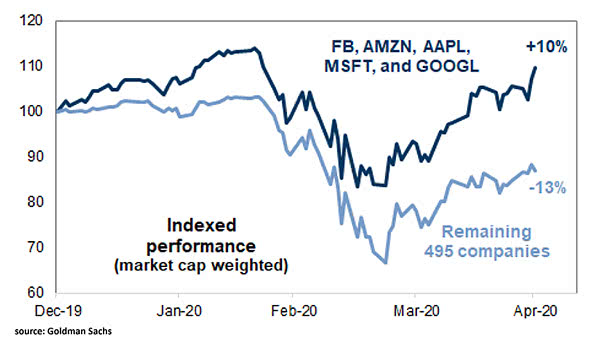
S&P 500: FAAMG vs. Remaining 495 Companies Will FAAMG’s outperformance persist in a stagflation environment? Image: Goldman Sachs Global Investment Research
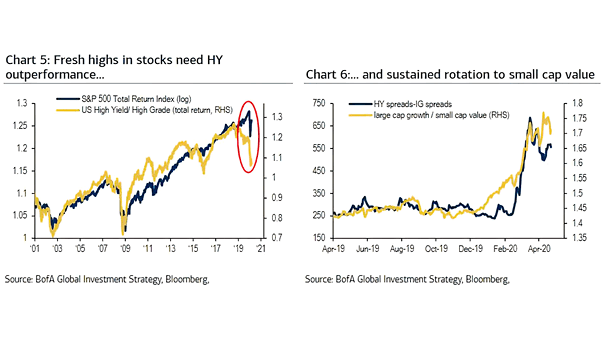
S&P 500 vs. U.S. High Yield/High Grade and Large Cap Growth to Small Cap Value Charts suggesting that new highs in stocks need high yield outperformance and sustained rotation from large cap growth to small cap value. Image: BofA Global Investment Strategy
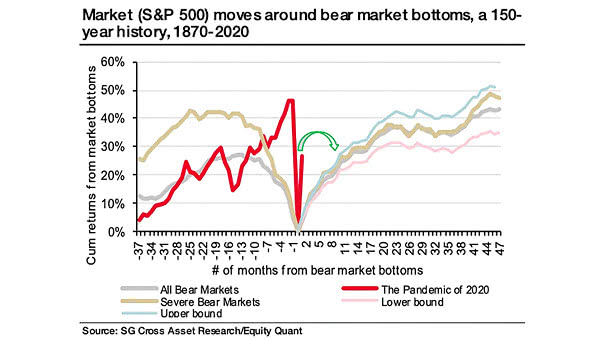
S&P 500 Moves Around Bear Market Bottoms Since 1870 If the March lows is the bottom, then the S&P 500 is well ahead of history in terms of market recovery. Image: Societe Generale Cross Asset Research
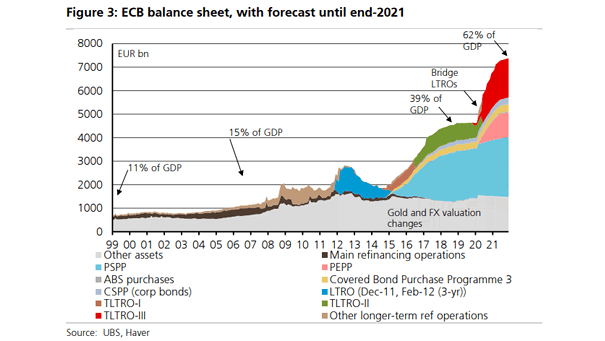
ECB Balance Sheet, with Forecast Until End-2021 The ECB’s balance sheet is expected to expand further and hit 62% of GDP in 2021. Image: UBS
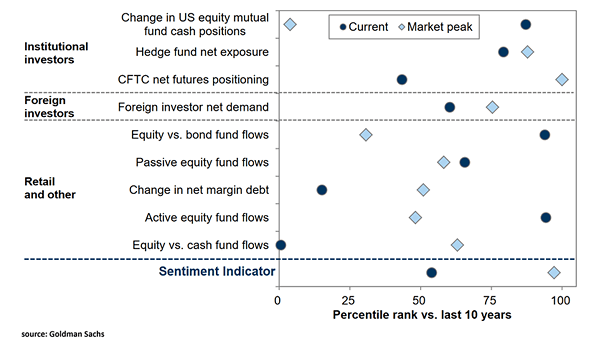
Sentiment Indicator – Current vs. Market Peak Currently, this sentiment indicator is relatively bullish compared to the last ten years. Image: Goldman Sachs Global Investment Research
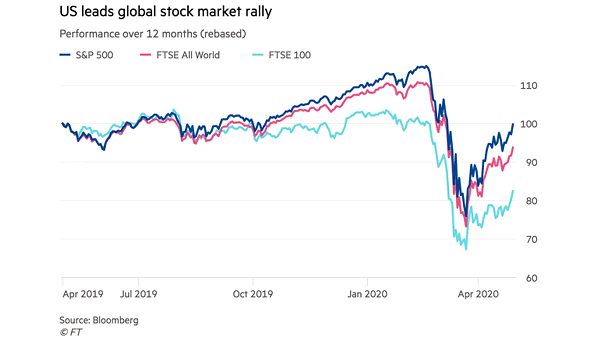
Performance over 12 Months: S&P 500 vs. FTSE All World and FTSE 100 U.S. equities had their best month since 1987, in the global rebound. Image: Financial Times
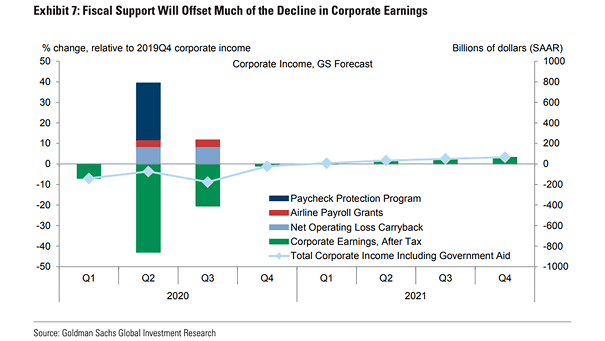
Forecast in Corporate Earnings Fiscal support will largely, but not entirely, offset the decline in coporate earnings. Image: Goldman Sachs Global Investment Research
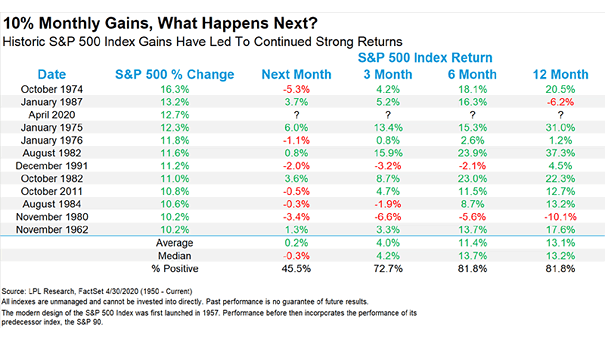
S&P 500 and 10% Monthly Gains, What Happens Next? Historically, 10% monthly gains for the S&P 500 have led to continued strong returns. Image: LPL Research