S&P 500 vs. S&P 500 Ex-Megacap Growth
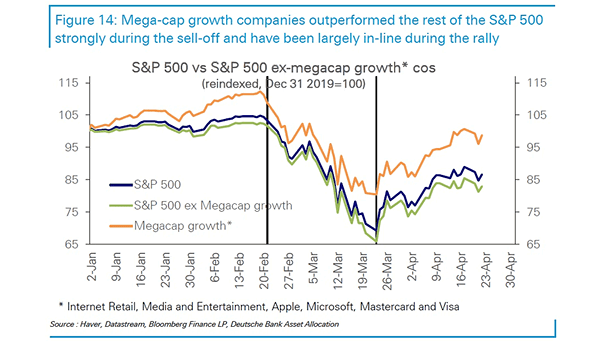
S&P 500 vs. S&P 500 Ex-Megacap Growth Mega-cap growth stocks have outperformed the rest of the S&P 500 so far this year. Image: Deutsche Bank Asset Allocation
S&P 500 vs. S&P 500 Ex-Megacap Growth Mega-cap growth stocks have outperformed the rest of the S&P 500 so far this year. Image: Deutsche Bank Asset Allocation
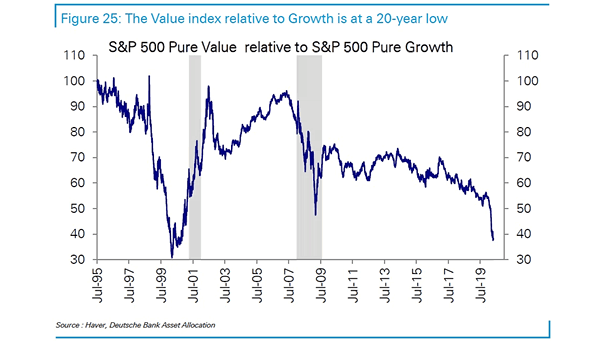
S&P 500 Pure Value Relative to S&P 500 Pure Growth The value index relative to growth has fallen to a 20-year low. Image: Deutsche Bank Asset Allocation
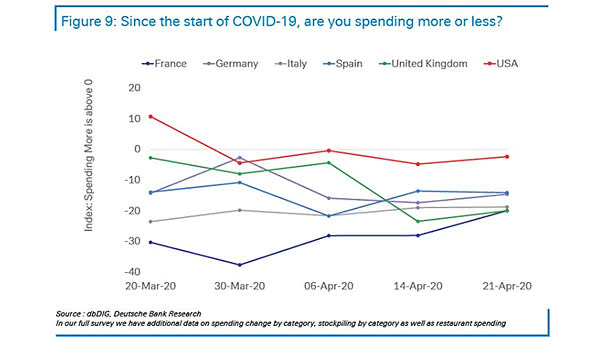
Coronavirus – Since the Start of COVID-19, Are You Spending More or Less? Since the start of COVID-19, this survey suggests that Americans are not spending less. Image: Deutsche Bank Research
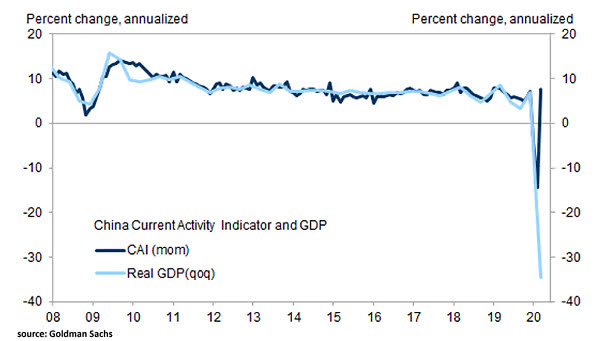
China Current Activity Indicator (CAI) and GDP The China current activity indicator (CAI) suggests a sharp recovery, after a deep contraction in the first quarter. Image: Goldman Sachs Global Investment Research
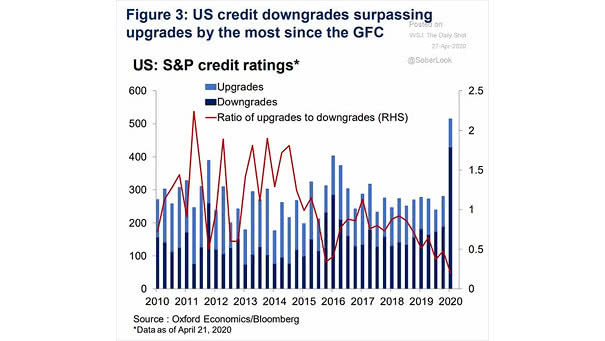
S&P Credit Ratings Downgrades The coronavirus crisis sparks record company downgrades. Image: Oxford Economics
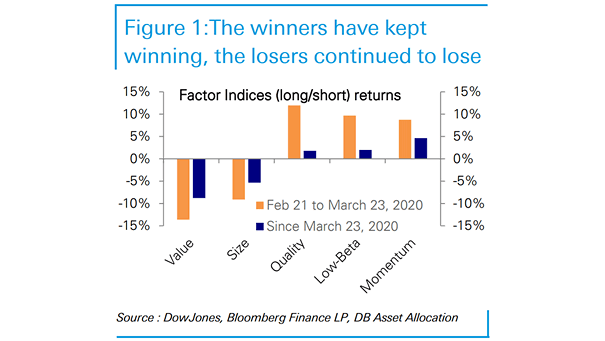
Factor Indices (Long/Short) Returns Since March low, the losers have continued to lose. Image: Deutsche Bank Asset Allocation
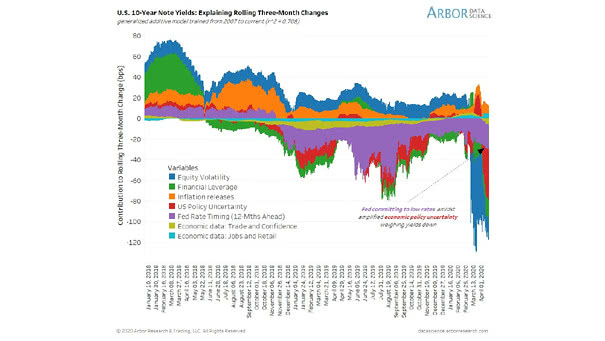
U.S. 10-Year Note Yields: Explaining Rolling Three-Month Changes Chart suggesting that U.S. policy uncertainty and Fed committing to low rates explain U.S. 10-year Treasury note yield. Image: Arbor Research & Trading LLC
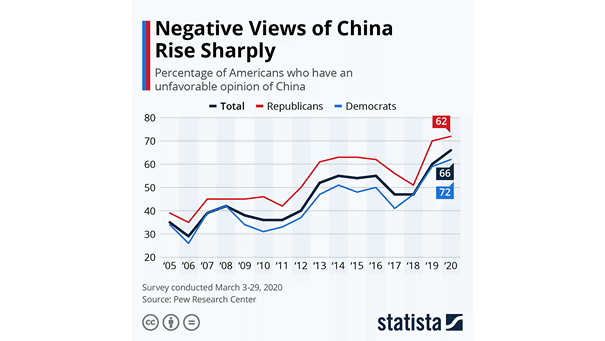
Percentage of Americans Who Have an Unfavorable Opinion of China A majority of Americans have a negative view of China. Image: Statista
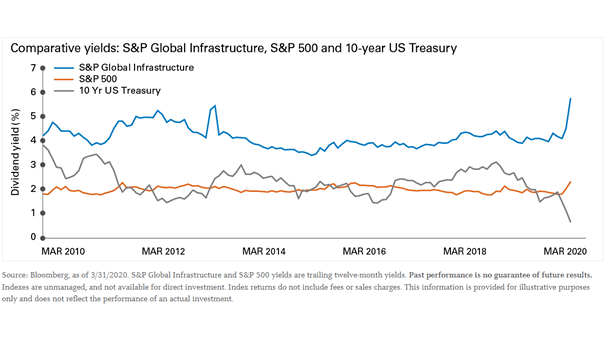
Comparative Yields: S&P Global Infrastructure, S&P 500 and 10-Year U.S. Treasury The yields offered by global infrastructure stocks appear attractive relative to the low yields across the bond market. Image: Legg Mason
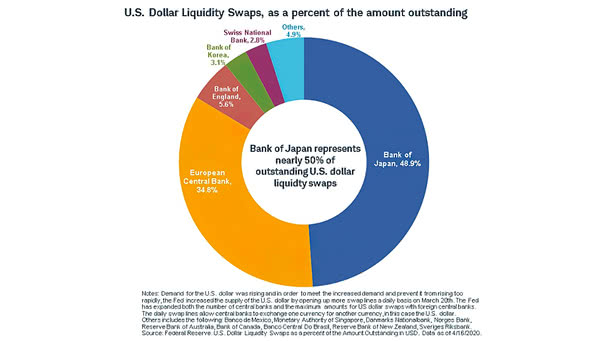
U.S. Dollar Liquidity Swaps, as a Percent of the Amount Outstanding The Bank of Japan represents nearly 50% of outstanding U.S. dollar liquidity swaps, a much higher rate than any other central bank. Image: Charles Schwab
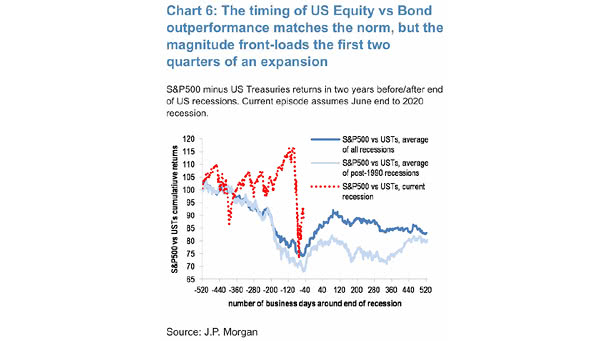
S&P 500 Minus U.S. Treasuries Returns in Two Years Before/After End of U.S. Recessions This chart suggests that the current episode assumes the U.S. recession ends in June 2020. Image: J.P. Morgan