S&P 500 Performance Over Past 12 Months
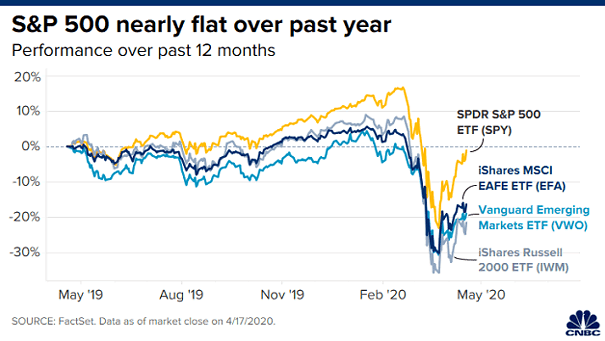
S&P 500 Performance Over Past 12 Months Although volatility has been high, the S&P 500 is little changed over the past 12 months. Image: CNBC
S&P 500 Performance Over Past 12 Months Although volatility has been high, the S&P 500 is little changed over the past 12 months. Image: CNBC
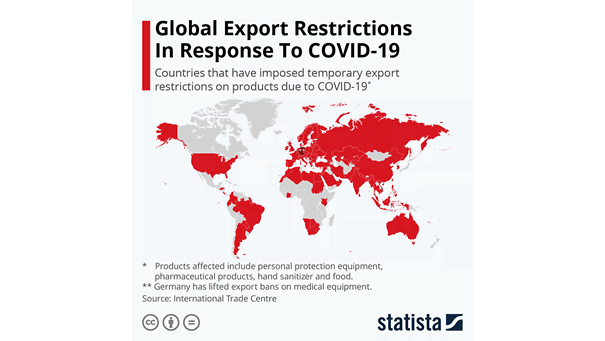
Global Export Restrictions in Response to Coronavirus Bans may backfire, as many countries impose export restrictions. Image: Statista
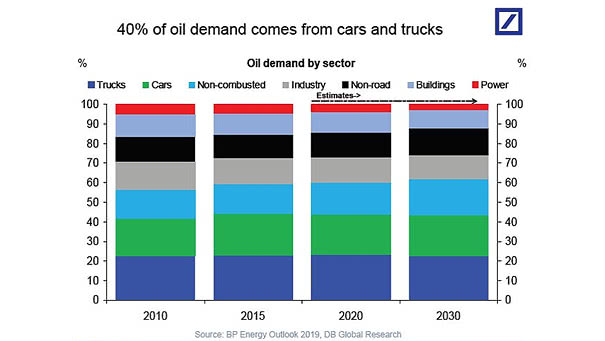
Oil Demand by Sector It may take a while for oil demand to rebound, as cars and trucks account for 40% of oil demand. Image: Deutsche Bank Global Research
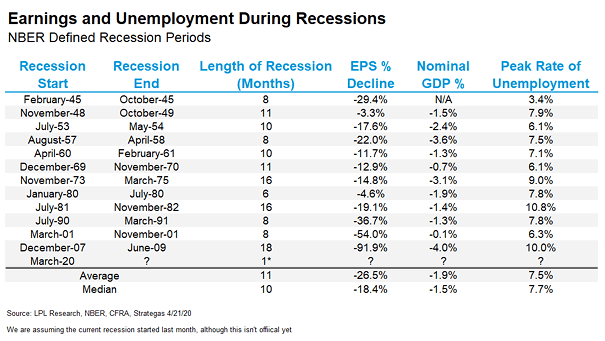
Earnings and U.S. Unemployment During Recessions On average, a recession lasts 11 months, earnings decline by 26.5%, nominal GDP falls by 1.9%, and the unemployment rate peaks at 7.5%. Image: LPL Research
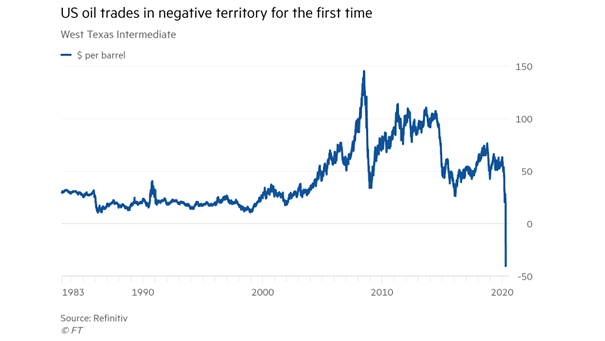
WTI Crude Oil Plunges Below Zero This chart shows the price of WTI crude oil below zero for the first time in history. Image: Financial Times
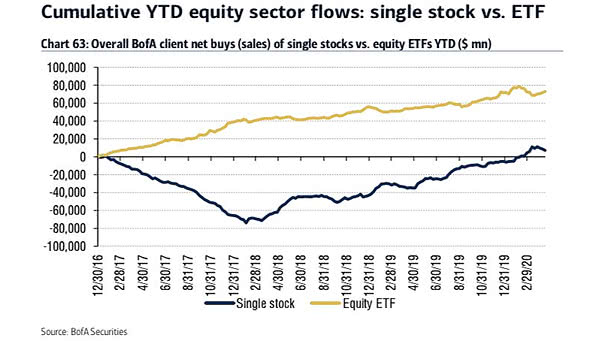
Cumulative YTD Equity Sector Flows: Single Stock vs. ETF BofA clients bought ETFs and sold single stocks for the four week. Image: BofA Securities
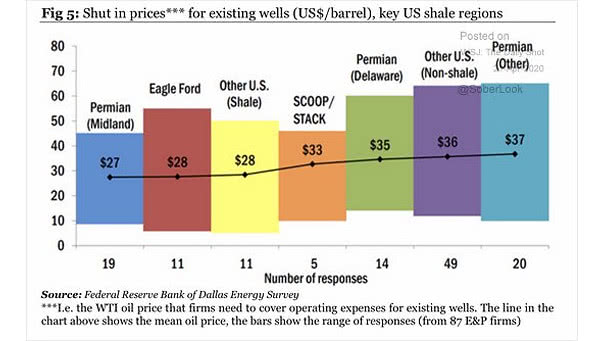
Breakeven Prices for Existing U.S. Oil Wells Breakeven prices for existing U.S. oil wells highlights that the current WTI oil price is too low for oil companies to make a decent return. Image: Federal Reserve Bank of Dallas Energy Survey
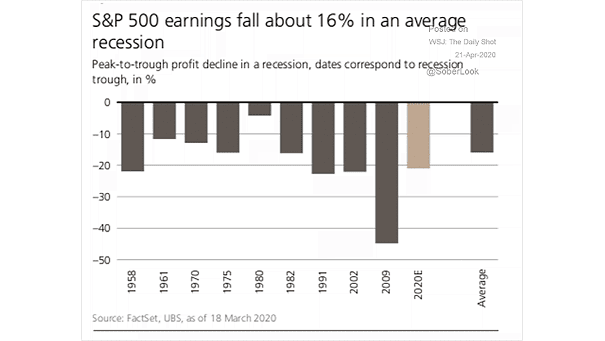
S&P 500 Earnings: S&P 500 Peak-to-Trough Profit Decline in a Recession S&P 500 earnings fall about 16% in an average recession. Image: UBS
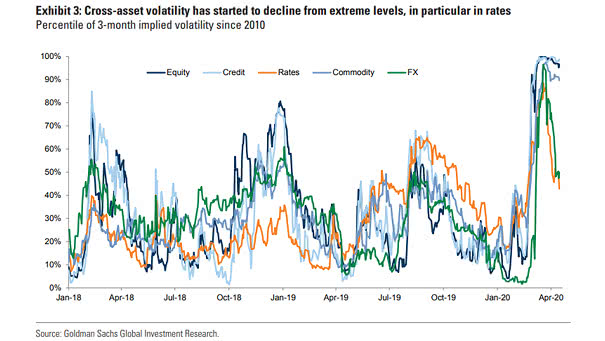
Cross-Asset Volatility and Percentile of 3-Month Implied Volatility Cross-asset volatility is declining from very high levels, as sentiment has improved and new coronavirus cases have declined. Image: Goldman Sachs Global Investment Research
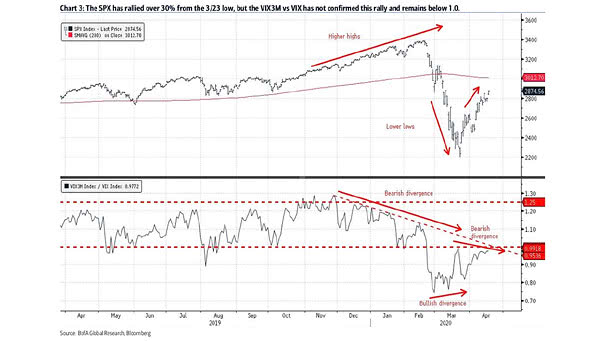
S&P 500 and 3-Month VIX vs. VIX The VIX3M vs. VIX has not confirmed the current rally and still remains below 1.0 in a sign of risk aversion. Image: BofA Global Research
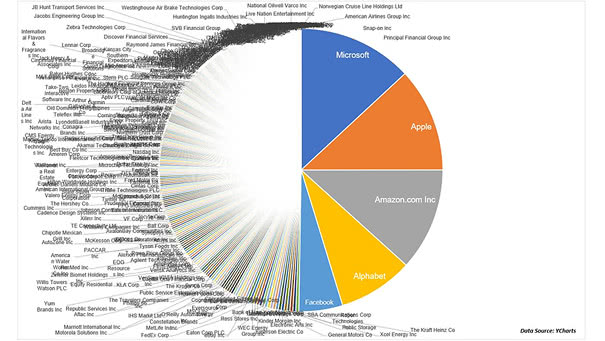
The Five Biggest Stocks in the S&P 500 The five biggest tech stocks dominate the S&P 500 Index. Image: Ritholtz Wealth Management LLC