Recovery of the S&P 500
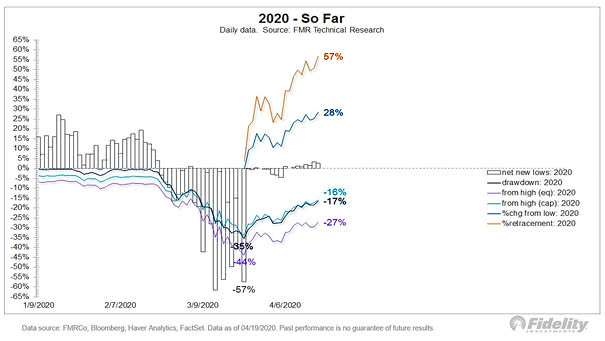
Recovery of the S&P 500 The S&P 500 has retraced more than 50% of its 35% decline in just 19 trading days. Image: Fidelity Investments
Recovery of the S&P 500 The S&P 500 has retraced more than 50% of its 35% decline in just 19 trading days. Image: Fidelity Investments
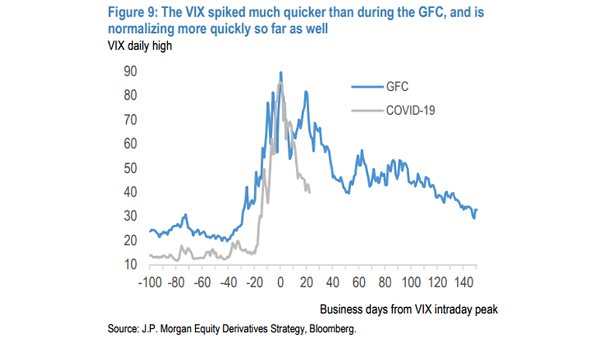
VIX – 2020 Coronavirus Crisis vs. Global Financial Crisis The coronavirus crisis saw the VIX spiked much quicker than during the global financial crisis, and is normalizing more quickly as well. Image: J.P. Morgan Equity Derivatives Strategy
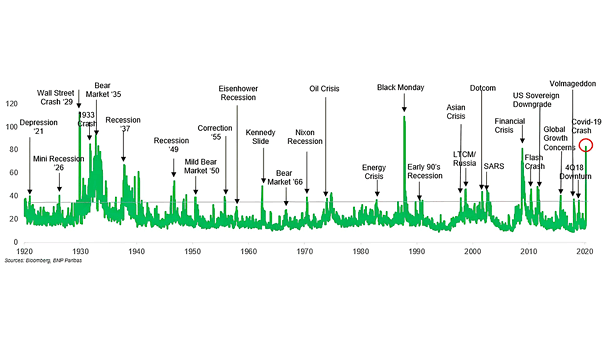
Volatility – VIX over a Century The stock market crash of 1929, the Black Monday of 1987, the global financial crisis in 2008, and the coronavirus crash were the most extreme events. Image: BNP Paribas
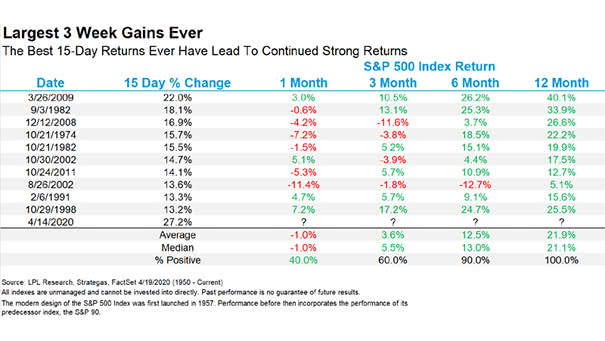
S&P 500 and Best 15-Day Returns Ever Historically, the best 15-day returns ever have lead to strong returns over the next 12 months, with an average gain of 21.9%. Image: LPL Research
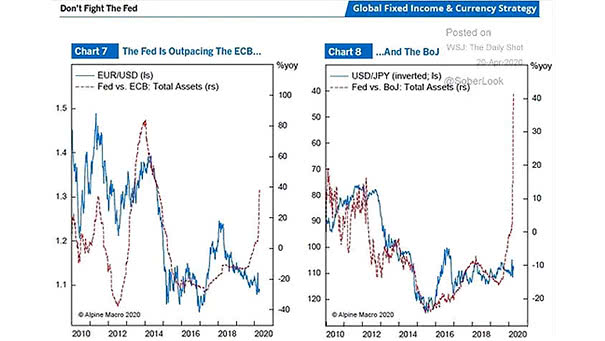
U.S. Dollar – Don’t Fight the Fed The U.S. dollar remains relatively strong despite Fed action. Image: Alpine Macro
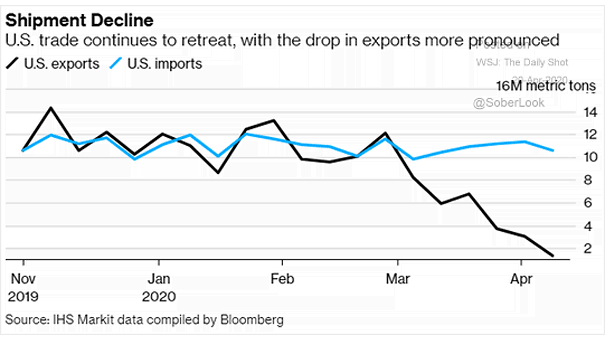
U.S. Trade and Shipment Decline (Imports – Exports) Chart showing the US trade collapse, as the coronavirus plunges the global economy into recession. Image: Bloomberg
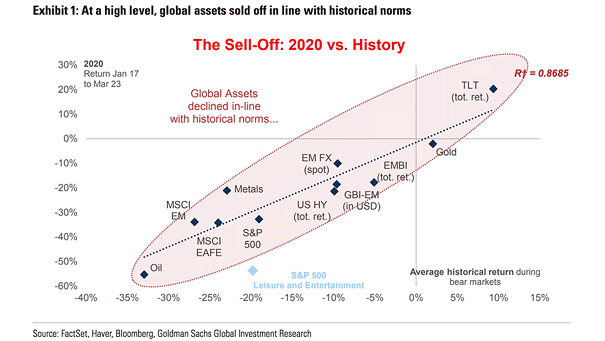
Bear Markets – The 2020 Sell-Off vs. History Global assets declined in-line with historical norms during the coronavirus crisis. Image: Goldman Sachs Global Investment Research
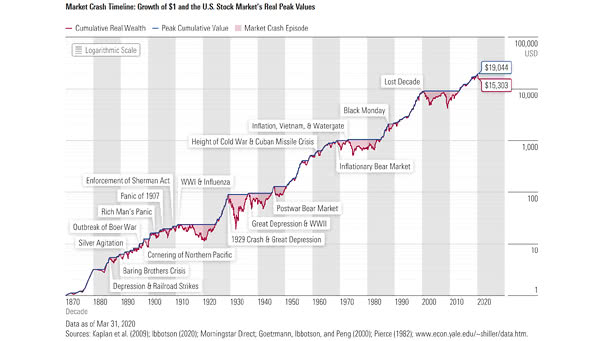
Market Crash Timeline: Growth of $1 and the U.S. Stock Market’s Real Peak Values This chart shows that patience is key for investment returns, as market crashes are frequent. Image: Morningstar
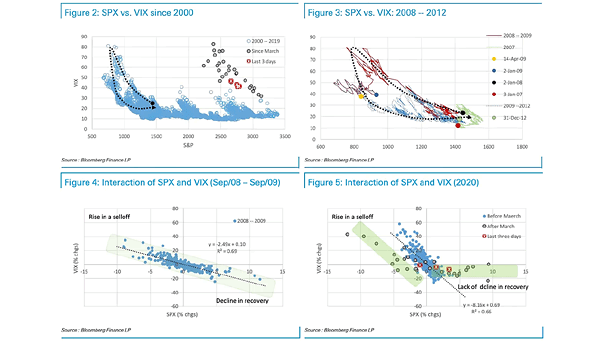
Interaction of S&P 500 and VIX In contrast to 2008, the current VIX and its lack of decline in recoveries suggest volatility in equities could persist. Image: Deutsche Bank
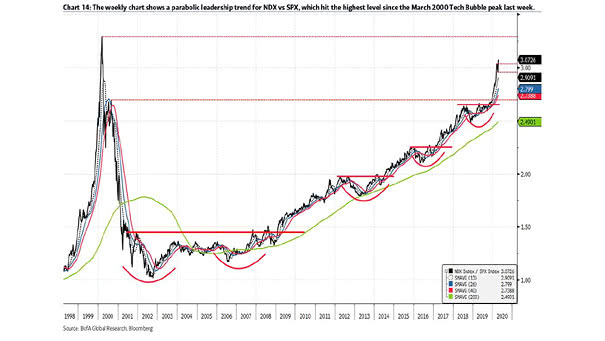
Trend for Nasdaq vs. S&P 500 The trend for Nasdaq vs. S&P 500 hit the highest level since the dotcom bubble, as investors have favored growth stocks. Image: BofA Global Research
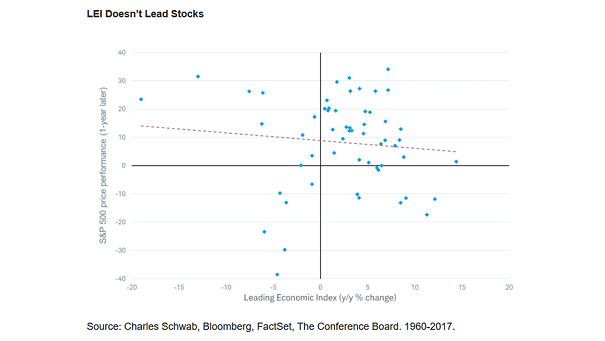
Conference Board Leading Economic Index (LEI) and S&P 500 This chart suggests that the Conference Board Leading Economic Index doesn’t lead the S&P 500 price performance. Image: Charles Schwab