U.S. Treasury Issuance and Fed QE
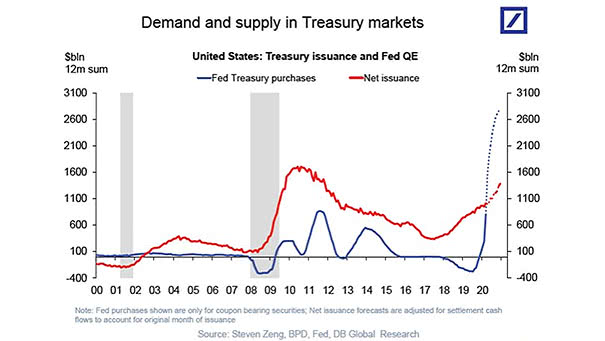
U.S. Treasury Issuance and Fed QE What’s the impact of quantitative easing? The Fed is now expected to buy double the amount of U.S. Treasury net issuance. Image: Deutsche Bank Global Research
U.S. Treasury Issuance and Fed QE What’s the impact of quantitative easing? The Fed is now expected to buy double the amount of U.S. Treasury net issuance. Image: Deutsche Bank Global Research
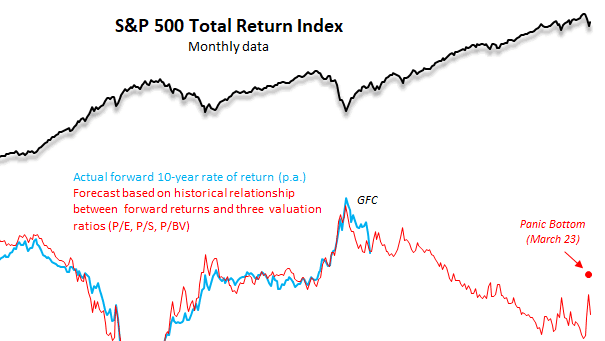
S&P 500 Total Return Index and Actual Forward 10-Year Rate of Return This chart suggests that the long-term return forecast is around 3.5% now vs. 8% p.a. at March bottom (R² = 0.91). Image: Hondo Tomasz
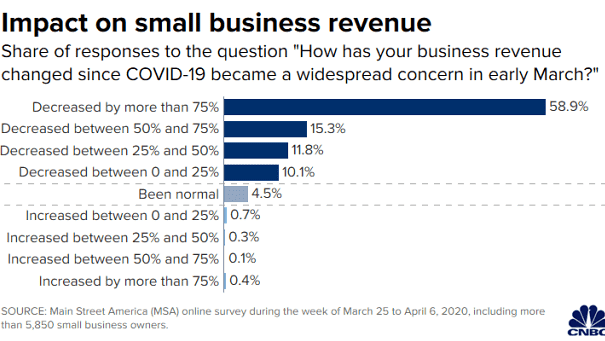
Impact on U.S. Small Business Revenue Since Coronavirus Became a Widespread Concern in Early March Around 59% of U.S. small businesses saw revenue drop by 75% or more due to the coronavirus pandemic. Image: CNBC
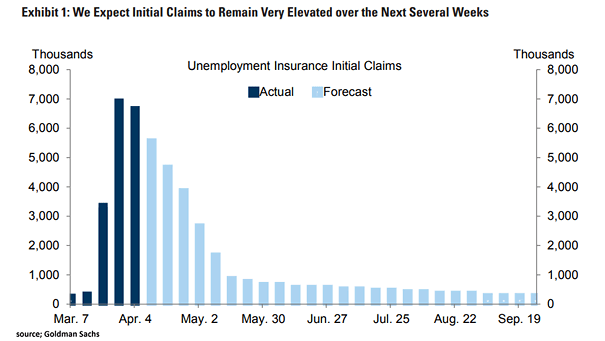
U.S. Unemployment Insurance Initial Claims Goldman Sachs expects initial claims to remain very high over the next several weeks. Image: Goldman Sachs Global Investment Research
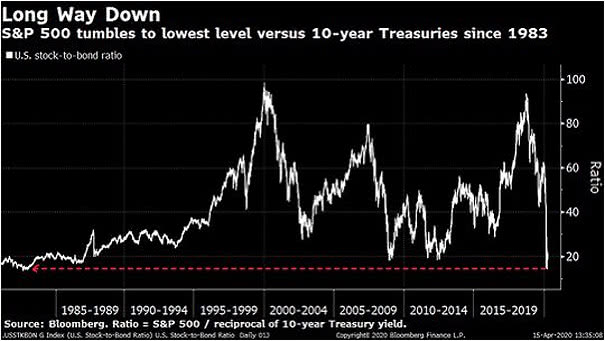
S&P 500 Relative to 10-Year Treasury Yield S&P 500 relative to 10-year Treasury yield at lowest level since 1983. Image: Bloomberg
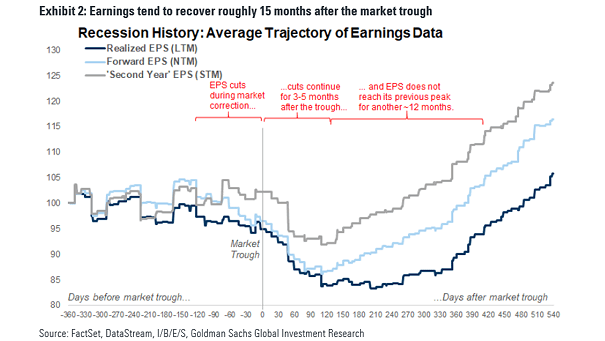
Recession History – Average Trajectory of Earnings Data The market tends to bottom well in advance (15 months on average) before earnings recover. Image: Goldman Sachs Global Investment Research
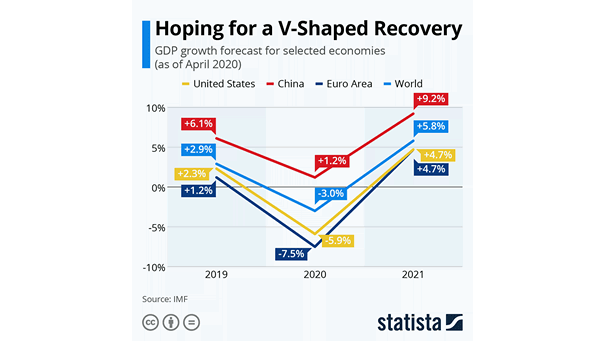
GDP Growth Forecast for Selected Economies The International Monetary Fund is predicting a V-shaped recovery for the global economy. Image: Statista
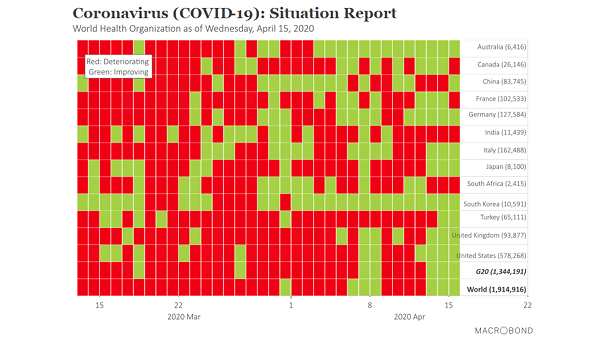
Coronavirus (COVID-19) – Situation Report This chart shows that the number of new coronavirus cases, below the 5-day average (green observations), is improving worldwide. Image: Macrobond Financial
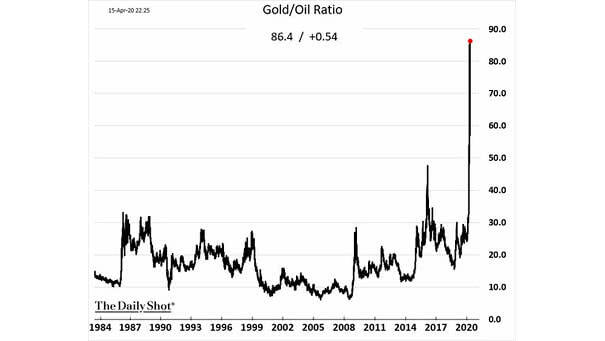
Gold to Oil Ratio at All Time Highs This chart suggests that the gold to oil ratio is not expected to remain at these levels for long. Image: The Daily Shot
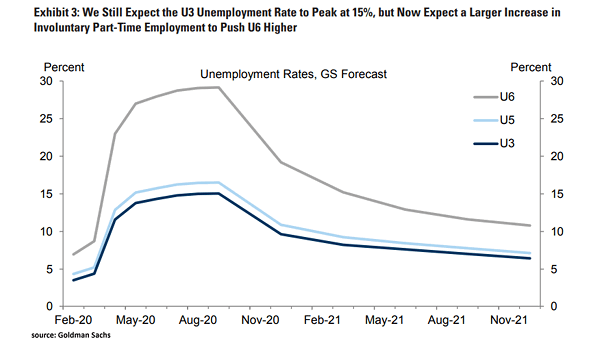
U.S. Unemployment Rates Forecast Goldman Sachs expects U3 unemployment rate to peak at 15%. Image: Goldman Sachs Global Investment Research
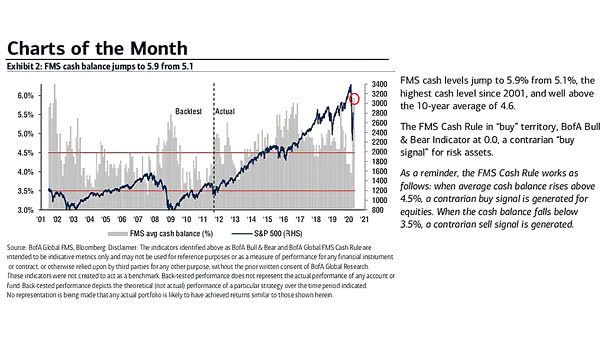
FMS Cash Balance vs. S&P 500 The BofA Fund Manager Survey cash balance jumps to 5.9%, highest since right after 9/11. This is an interesting contrarian indicator. Image: BofA Global FMS