U.S. High Yield Default Rate
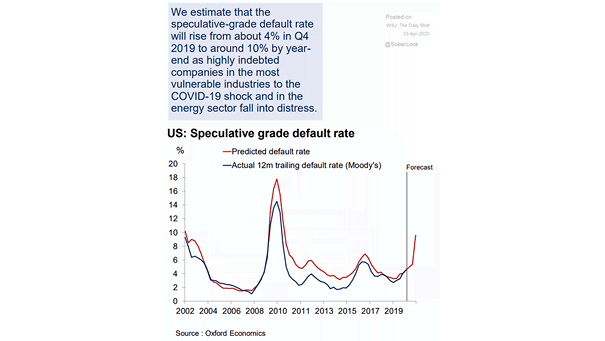
U.S. High Yield Default Rate This chart suggests that U.S. high yield default rate could rise to 10% by year-end. Image: Oxford Economics
U.S. High Yield Default Rate This chart suggests that U.S. high yield default rate could rise to 10% by year-end. Image: Oxford Economics
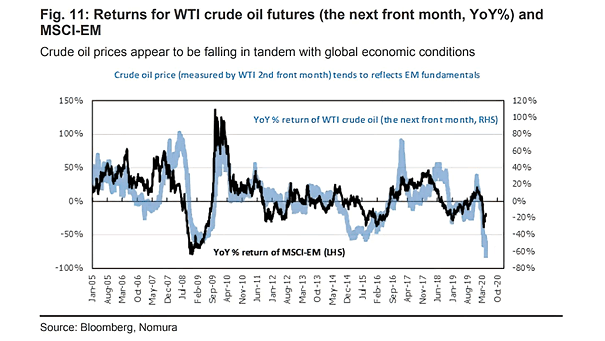
Returns for WTI Crude Oil Futures and MSCI Emerging Markets Index The WTI crude oil price tends to reflects EM fundamentals. Image: Nomura
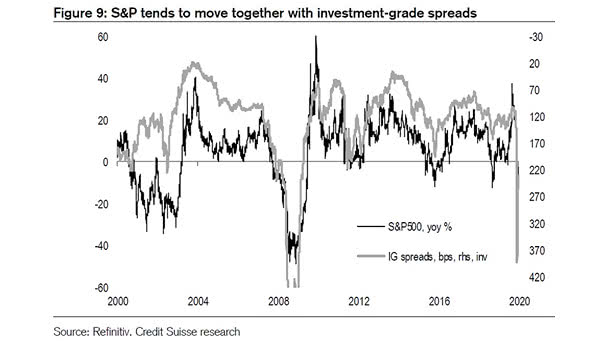
S&P 500 and Investment-Grade Spreads The S&P 500 tends to move together with investment-grade spreads. Image: Credit Suisse Research
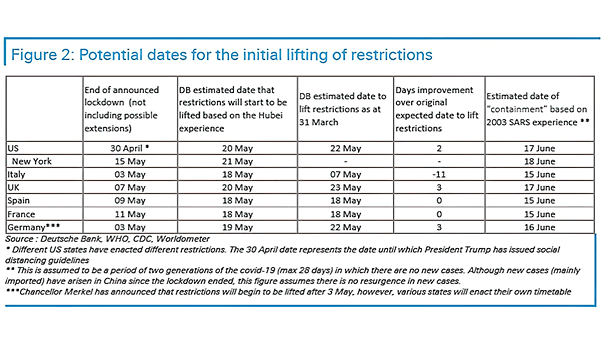
Potential Dates for the Initial Lifting of Coronavirus Restrictions This table suggests when some countries will lift their coronavirus lockdowns. Image: Deutsche Bank

World Oil: Demand vs. Supply By how much does oil supply exceed demand? Image: Alpine Macro

Cash – Money-Market Fund Assets Morgan Stanley’s wealth clients moved away from stocks into cash. Image: Bloomberg
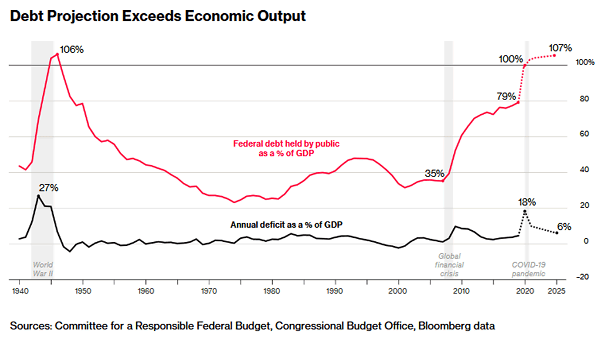
Federal Debt Held by Public and Annual U.S. Deficit The U.S. budget deficit may quadruple in 2020 to almost $4 trillion, and the stimulus will take the U.S. national debt to wartime levels. Image: Bloomberg
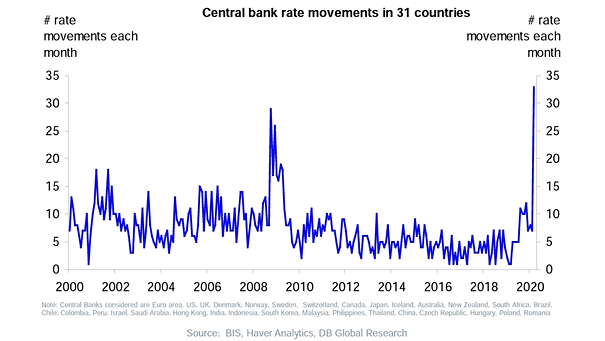
Central Bank Rate Movements in 31 Countries Central bank rate movements in 31 countries haven’t been this much since the Great Financial Crisis. Image: Deutsche Bank Global Research
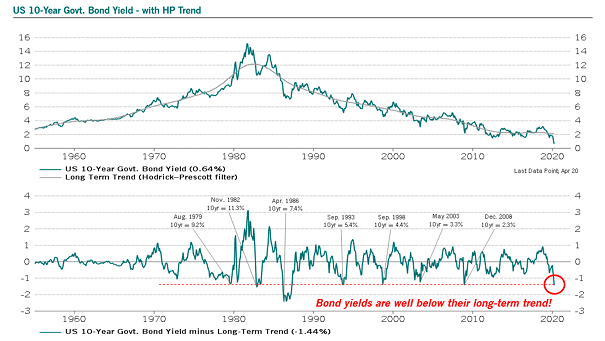
U.S. 10-Year Bond Yield and Long-Term Trend This chart suggests that bond yields are well below their long-term trend. Image: Pictet Asset Management
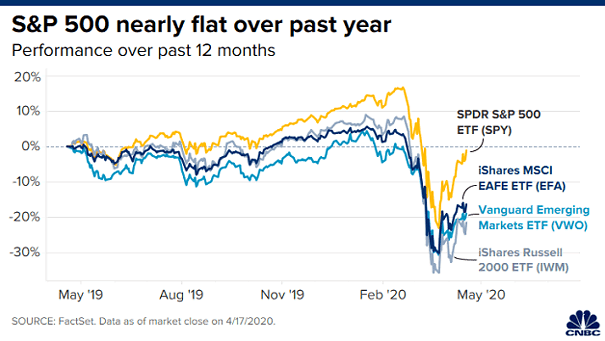
S&P 500 Performance Over Past 12 Months Although volatility has been high, the S&P 500 is little changed over the past 12 months. Image: CNBC
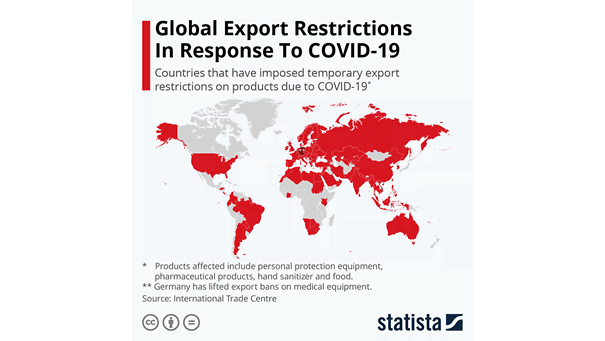
Global Export Restrictions in Response to Coronavirus Bans may backfire, as many countries impose export restrictions. Image: Statista