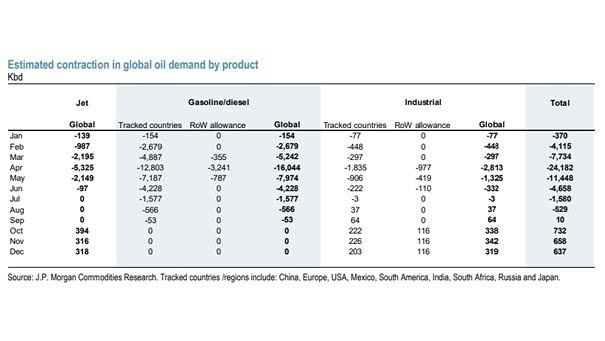
S&P 500 and Insider Buy vs. Sell Ratio

S&P 500 and Insider Buy vs. Sell Ratio Insider buying is at its highest level in nine years, as executives are confident their businesses will recover. Image: CNBC

S&P 500 – Speed of Recovery vs. Speed of Decline

S&P 500 – Speed of Recovery vs. Speed of Decline This chart shows 10 declines more than 30% since 1920, and the speed of recovery vs. the speed of decline. The current decline has been 35% in just 6 weeks. Image: Fundstrat Global Advisors, LLC

S&P 500 Index vs. Earnings per Share (EPS)

S&P 500 Index vs. Earnings per Share (EPS) Currently, the S&P 500 Index prices in a 15% decline in EPS. A decline of 33% from 2019 seems more appropriate, according to Goldman Sachs. Image: Jeroen Blokland

Economic Growth in China

Economic Growth in China As the chart shows, Chinese growth is worse than in 2008. Image: BCA Research

Amount of Distressed Bonds

Amount of Distressed Bonds Driven by the coronavirus pandemic and the collapse of oil prices, the amount of distressed bonds has surged to the highest level since 2009. Image: Bloomberg

U.S. Jobless Claims by States

U.S. Jobless Claims by States Coronavirus job losses hit the following states the hardest. Image: Yahoo Finance