S&P 500 – 2020 vs. 1929-30
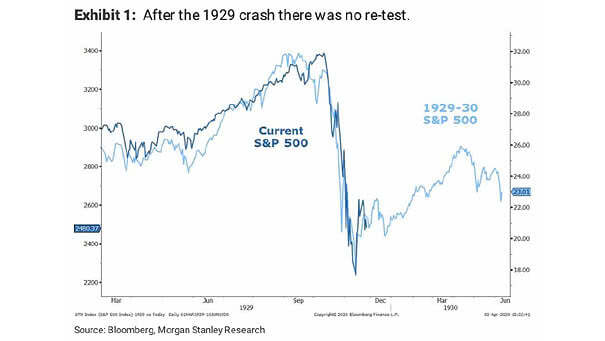
S&P 500 – 2020 vs. 1929-30 This chart suggests that the S&P 500 could find support without a full retest of the lows. Image: Morgan Stanley Research
S&P 500 – 2020 vs. 1929-30 This chart suggests that the S&P 500 could find support without a full retest of the lows. Image: Morgan Stanley Research
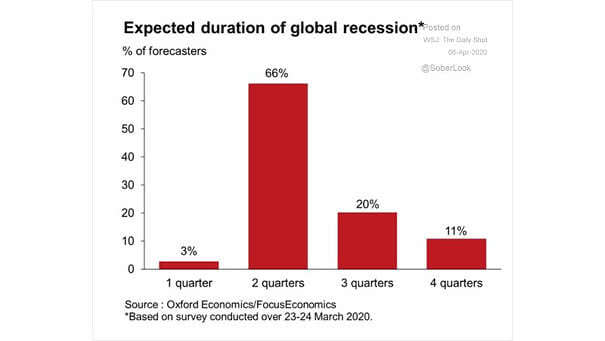
Expected Duration of Global Recession This chart suggests the expected duration of the global recession based on survey data. Image: Oxford Economics
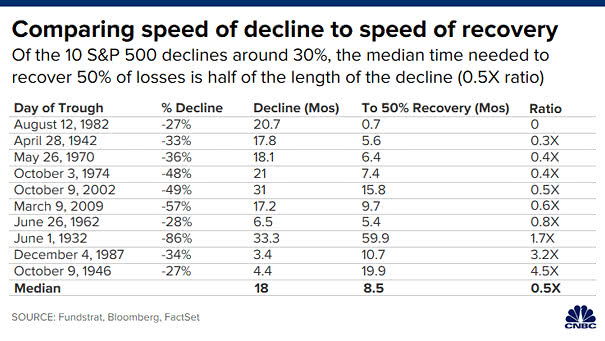
Bear Market – Comparing Speed of Decline to Speed of Recovery Of the 10 stock market drawdowns of about 30% since 1920, the median time needed to recover half of losses, was half the duration of the decline. Image: CNBC
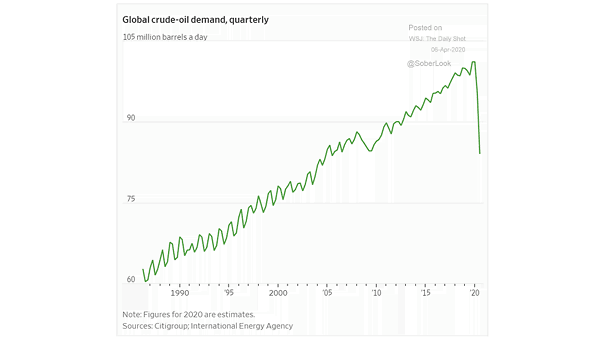
Global Crude Oil Demand Global demand for crude oil has fallen off a cliff, as the coronavirus pandemic spreads in the U.S. and around the world. Image: The Wall Street Journal
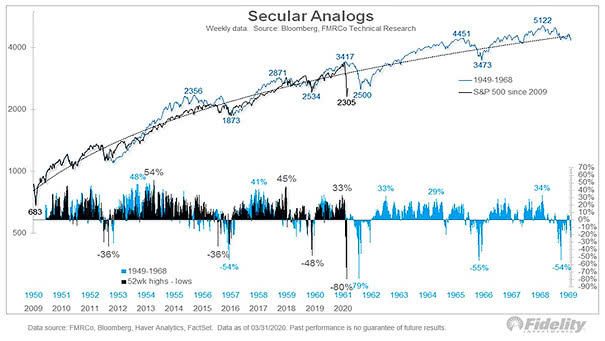
Secular Bull Market Analogs – 1949-1968 vs. S&P 500 since 2009 This chart compares the secular bull market of 1949-1968 vs. the S&P 500 since 2009. In 1962, the breadth thrust was about the same as today. Image: Fidelity Investments
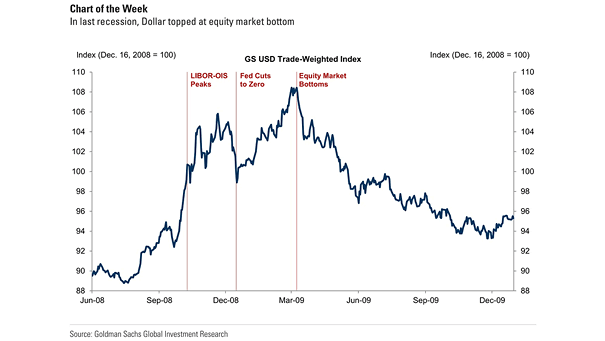
U.S. Dollar and Equity Market Bottom In the last recession, the U.S. dollar topped at the equity market bottom. Image: Goldman Sachs Global Investment Research
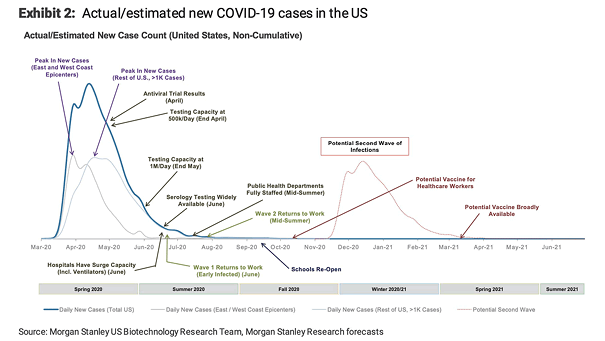
Actual and Estimated New Coronavirus Cases in the U.S. This chart suggests a potential second wave of infections in the United States in the fall of 2020. Image: Morgan Stanley Research
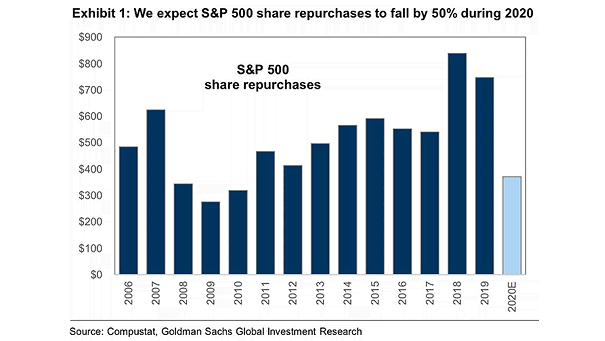
U.S. Buybacks Goldman Sachs expects buybacks to fall by 50% during 2020 compared with 2019 levels, suggesting slower EPS growth and less support for stock prices. Image: Goldman Sachs Global Investment Research
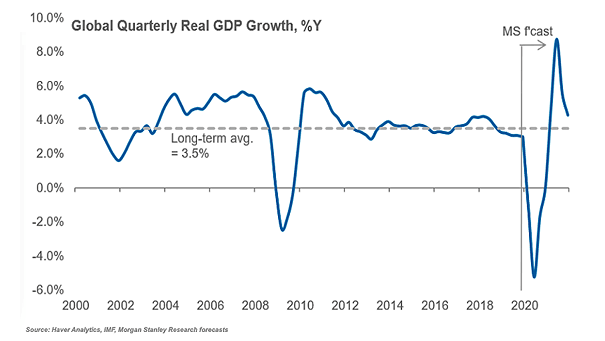
Global Quarterly Real GDP Growth Morgan Stanley forecasts global quarterly real GDP growth at -5.2% in Q2 2020. Image: Morgan Stanley Reasearch
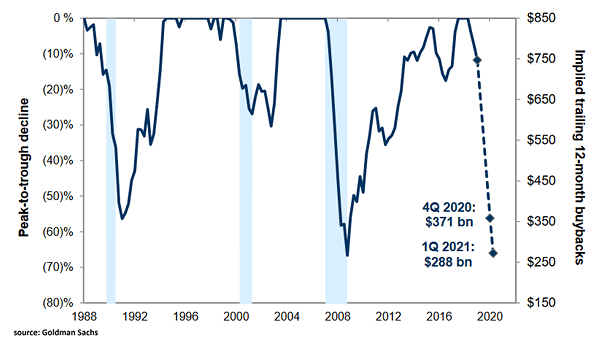
Implied Trailing 12-Month Buybacks Goldman Sachs expects a sharp decline in buybacks in 2020 and 2021, suggesting less support for stock prices and slower EPS growth. Image: Goldman Sachs Global Investment Research
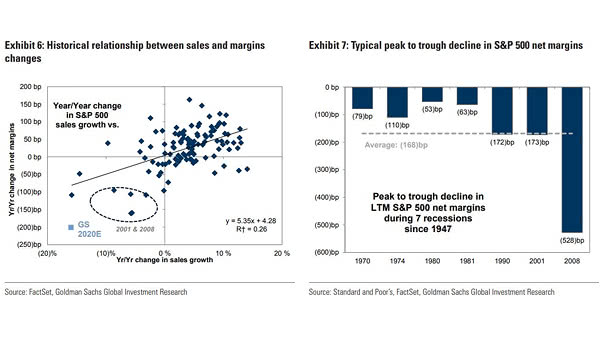
Typical Peak to Trough Decline in S&P 500 Net Margins The peak to trough decline in S&P 500 net margins is 168 bp on average during past recessions. Goldman Sachs expects a contraction in net margin by 200 bp in 2020. Image: Goldman Sachs Global Investment Research