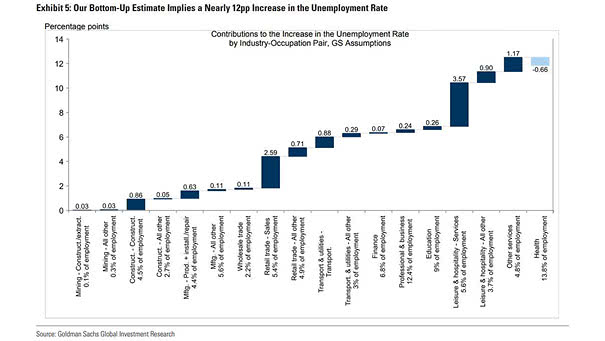
Cumulative Bond Flows Since 2009

Cumulative Bond Flows Since 2009 Flows into high-yield funds had been out of favor in this cycle. Is this good news? Image: Deutsche Bank Asset Allocation

U.S. Equity Mutual Funds Flow

U.S. Equity Mutual Funds Flow U.S. equity mutual funds have experienced the biggest drop in asset under management since 2008. Image: Macrobond Financial

S&P 500 30% Pullbacks

S&P 500 30% Pullbacks It took only 22 trading days for the S&P 500 to fall 30% from its record high. Image: CNBC

Gold, U.S. Trade Weighted Dollar and S&P 500

Gold, U.S. Trade Weighted Dollar and S&P 500 In 2008, gold outperperformed after the Fed stepped in and removed liquidity constraints. Image: Goldman Sachs Global Investment Research

U.S. GDP Forecast for 2020

U.S. GDP Forecast for 2020 J.P. Morgan suggests that U.S. GDP in Q2 will be the worst on record. Image: Bloomberg

Historic U.S. Bear Market

Historic U.S. Bear Market This chart shows the S&P 500 drop from peak and recovery until next peak. Image: Macrobond Financial