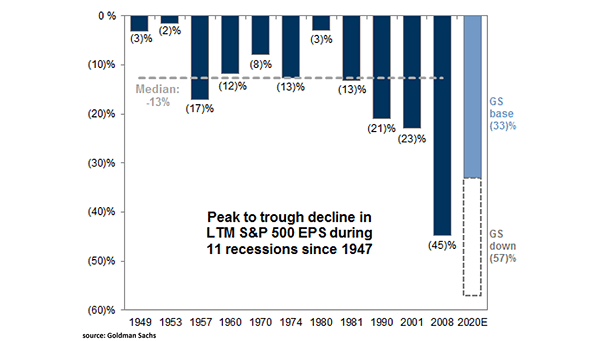
S&P 500 in 2020 and Similarities with 2008
S&P 500 in 2020 and Similarities with 2008 If the S&P 500 follows the 2008 trajectory, it could bottom in August 2020. Image: Nordea and Macrobond
U.S. Unemployment Rate Average of All Recessions This chart puts into perspective the U.S. unemployment rate during recessions and during the depression. Image: Nordea and Macrobond
Peak to Trough Equity Move Around Past Recessions Historically, the average move in the S&P 500 from peak to trough around past recessions is -32%. Image: J.P. Morgan
Dow Jones Industrial Average and 1918 Pandemic Flu During the influenza pandemic of 1918, the Dow Jones fell 33% and the rebound was muted. Image: Deutsche Bank Global Research
S&P 500 YoY EPS Growth Goldman Sachs now forecasts S&P 500 EPS of $110 this year. Image: Goldman Sachs Global Investment Research
Bull and Bear Markets This chart shows the S&P 500′s returns in bull and bear markets through history. Image: CNBC
Coronavirus Baseline Hit to the Level of U.S. Real GDP Goldman Sachs expects a nearly 10% peak hit to the level of U.S. GDP next month, which will gradually fade away. Image: Goldman Sachs Global Investment Research
VXO (old VIX) – Volatility Are such levels of volatility unusual? Yes, they are. Image: Fidelity Investments
S&P 500 – 2009-2020 Retracement Levels This chart shows retracement levels based on the move from the 2009 low to the recent 2020 high. Image: Fundstrat Global Advisors, LLC
Global Employment in S&P 500 Companies vs. Small Businesses Small and medium-sized businesses play an important role in the U.S. economy, as S&P 500 companies employ only 17% of U.S. workers. Image: Deutsche Bank Global Markets Research
Valuation – Price-to-Sales Ratio and Price-to-Book Ratio for the S&P 500 Index These charts suggest that the S&P 500 Index might have a lot further to fall. Image: Bloomberg