
U.S. GDP – Largest Annual Economic Contractions in the U.S. Since 1900
U.S. GDP – Largest Annual Economic Contractions in the U.S. Since 1900 Deutsche Bank predicts U.S. GDP to shrink -4.2% in 2020. Image: Deutsche Bank
U.S. GDP – Largest Annual Economic Contractions in the U.S. Since 1900 Deutsche Bank predicts U.S. GDP to shrink -4.2% in 2020. Image: Deutsche Bank
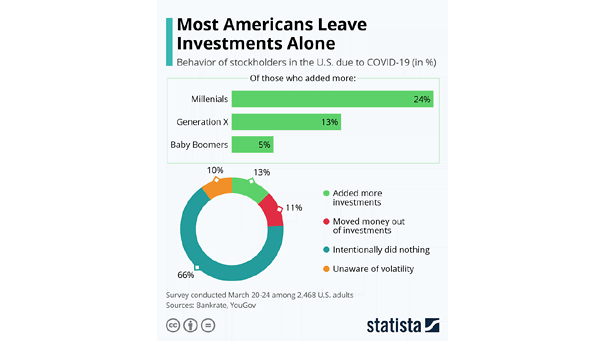
Behavior of Stockholders in the U.S. due to the Coronavirus As the chart shows, most Americans leave investments alone. Image: Statista
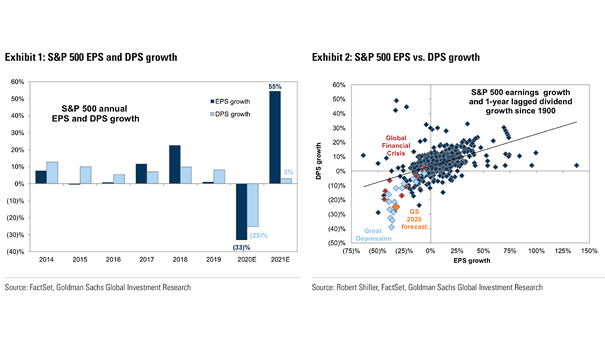
S&P 500 Earnings and Dividend Growth (S&P 500 EPS and DPS) This chart suggests estimates for earnings and dividend growth this year, highlighting the financial crisis and the Great Depression. Image: Goldman Sachs Global Investment Research

S&P 500 – Anatomy of a Decline Is this a new bull market? Not yet, although the S&P500 has gained 20% from the low of 2192. Image: Fidelity Investments
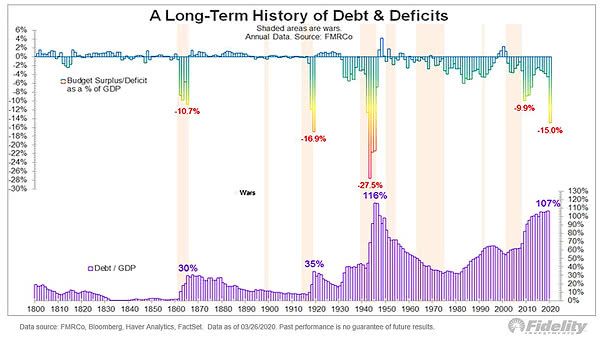
A Long-Term History of Debt & Deficits The U.S. federal deficit is skyrocketing and unusually large. Image: Fidelity Investments
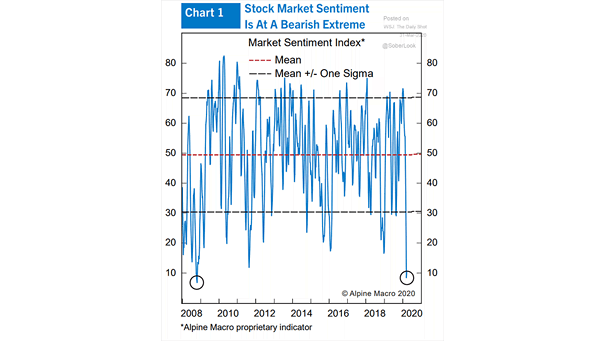
Market Sentiment Index The market sentiment index is at a bearish extreme, but the stock market can still decline further. Image: Alpine Macro
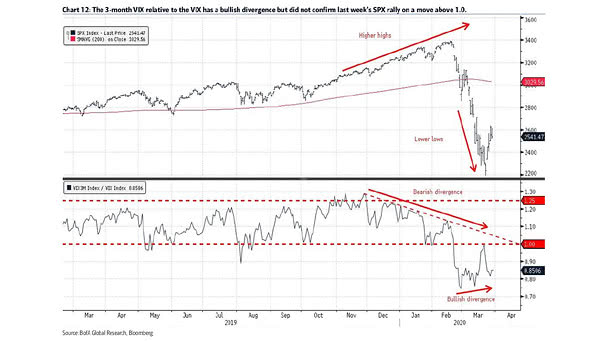
Volatility – 3-month VIX vs. VIX A sign of risk aversion, as the 3-month VIX relative to the VIX did not move above 1.0 and did not confirm last week’s S&P 500 rally. Image: BofA Global Research
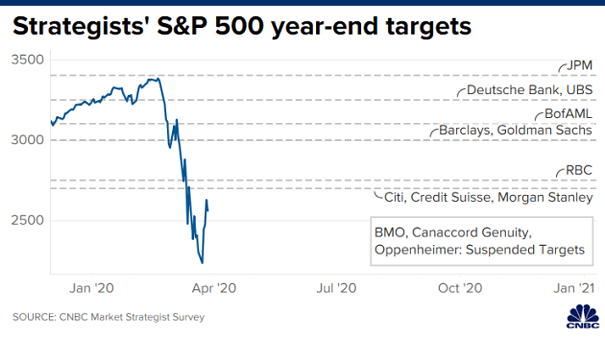
Strategists’ S&P 500 Year-End Targets Despite the extreme volatility, the consensus year-end target for the S&P 500 is now 3,038. Image: CNBC
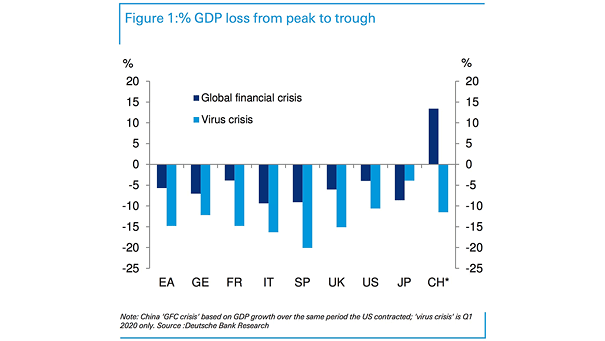
% GDP Loss from Peak to Trough – Coronavirus Crisis vs. Global Financial Crisis The peak-to-trough decline in the United States. and Euro Area, is likely to be more than double that of the global financial crisis. Image: Deutsche Bank Research
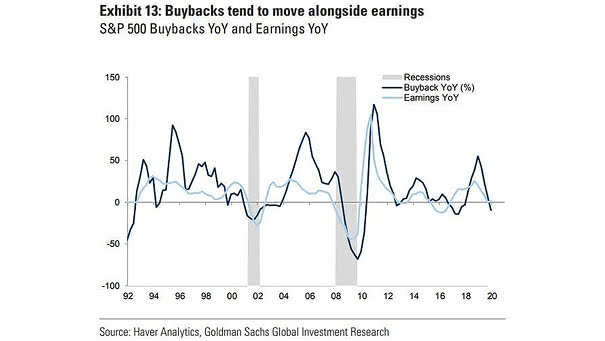
U.S. Buybacks vs. Earnings Buybacks tend to move alongside earnings and are likely to be reduced in 2020. Image: Goldman Sachs Global Investment Research
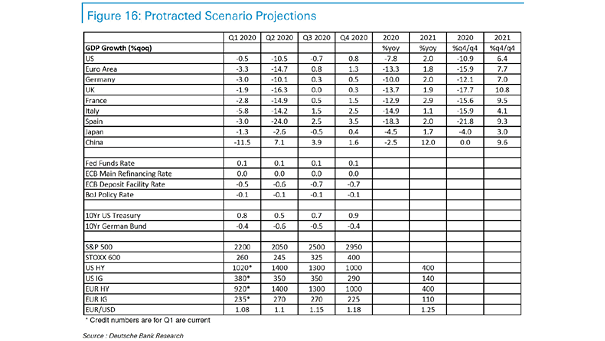
S&P 500, Treasury Bond, Global GDP, EUR/USD – Protracted Scenario Projections This table suggests protracted scenario projections. Image: Deutsche Bank Research