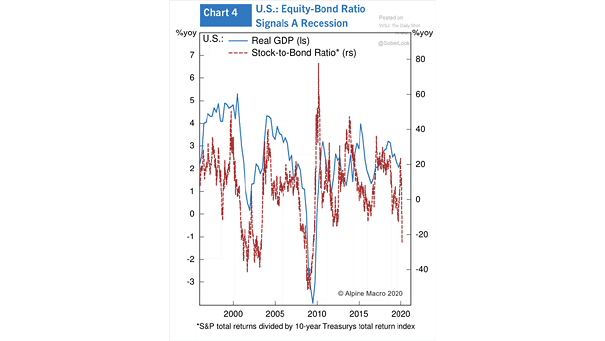
Recession – U.S. Real GDP and Stock-to-Bond Ratio
Recession – U.S. Real GDP and Stock-to-Bond Ratio This chart shows the correlation between US real GDP and the stock-to-bond ratio, suggesting a recession. Image: Alpine Macro
Recession – U.S. Real GDP and Stock-to-Bond Ratio This chart shows the correlation between US real GDP and the stock-to-bond ratio, suggesting a recession. Image: Alpine Macro
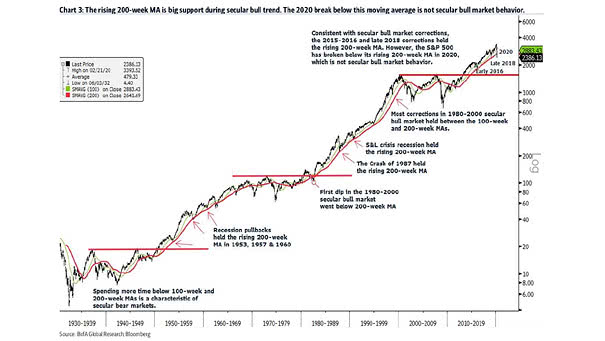
S&P 500 and Secular Bull Market Behavior The S&P 500 below the 200-week moving average is not secular bull market behavior. Image: BofA Global Research
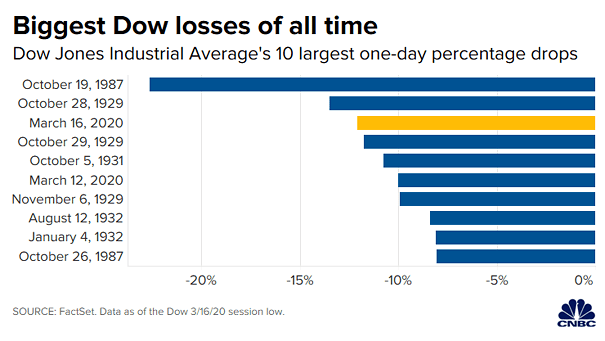
Dow Jones Industrial Average’s 10 Largest One-Day Percentage Drops Yesterday was one the biggest Dow Jones losses of all time. Image: CNBC
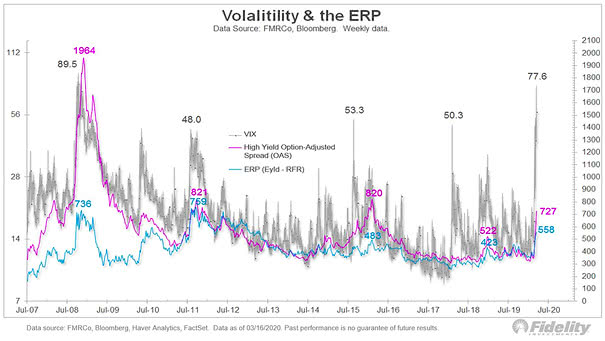
Volatility (VIX) and the Equity Risk Premium This chart shows that the equity risk premium tends to move with credit spreads. Image: Fidelity Investments
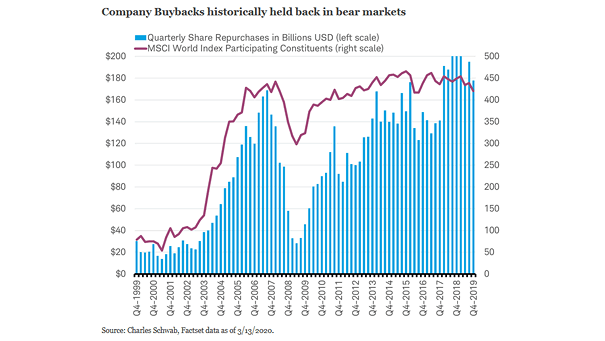
Buybacks – Quarterly Share Repurchases During Bull and Bear Markets This chart shows that companies tend to reduce buybacks during bear markets. Image: Charles Schwab
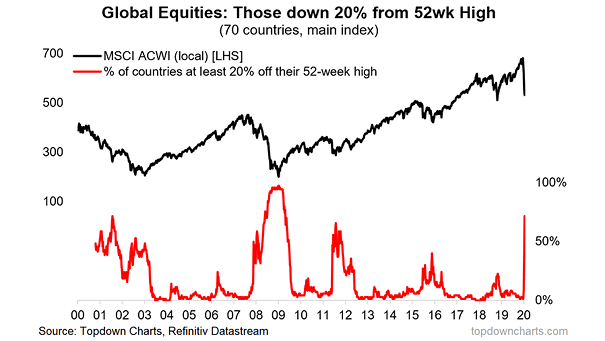
Global Equities and Bear Market Currently, 71% of countries are in a bear market. Image: Topdown Charts
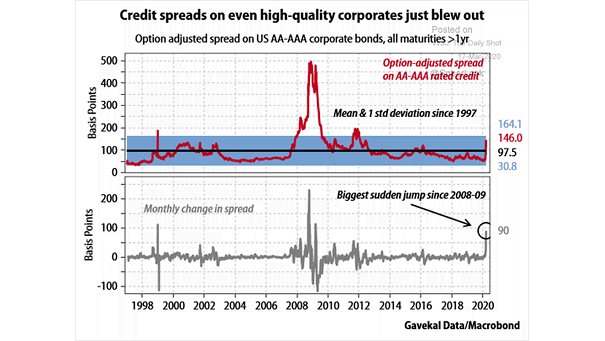
Credit Spreads on High-Quality U.S. Corporates Credit spreads on high-quality U.S. corporates are widening and are flashing a warning sign for markets. Image: Gavekal, Macrobond
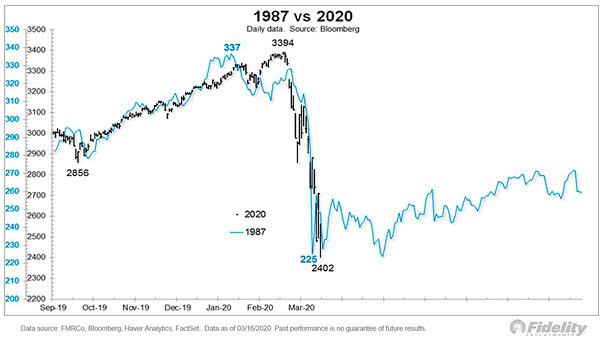
S&P 500 – 1987 vs. 2020 This chart compares the current decline with the 1987 crash. Image: Fidelity Investments
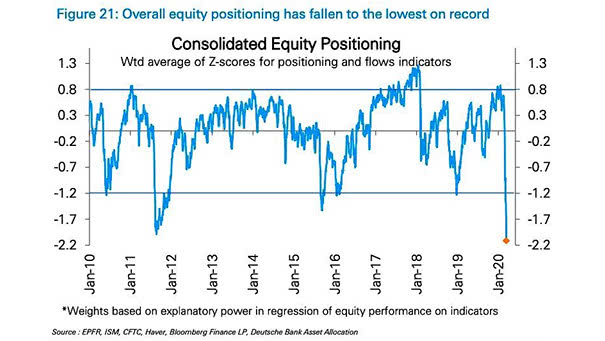
Consolidated Equity Positioning to the Lowest on Record Equities positioning are at their lowest level on record, as pessimistic investors price in recession risks. Image: Deutsche Bank Asset Allocation
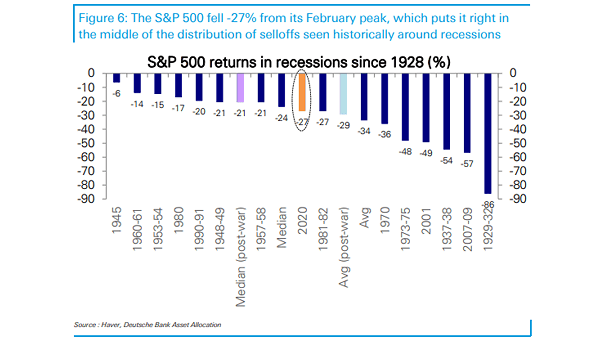
S&P 500 Returns in Recessions since 1928 Currently, the S&P 500 is in the middle of the distribution of selloffs seen historically around previous recessions. Image: Deutsche Bank Asset Allocation
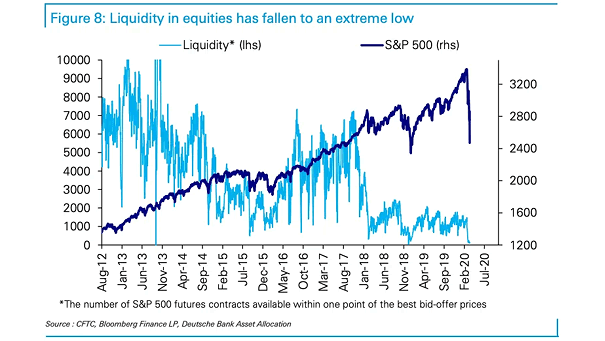
Liquidity and S&P 500 Liquidity in U.S. equity collapsed in early 2018 and remained at an extreme low. Lack of liquidity tends to lead to violent market moves. Image: Deutsche Bank Asset Allocation