S&P 500 Performance Around U.S. Recessions
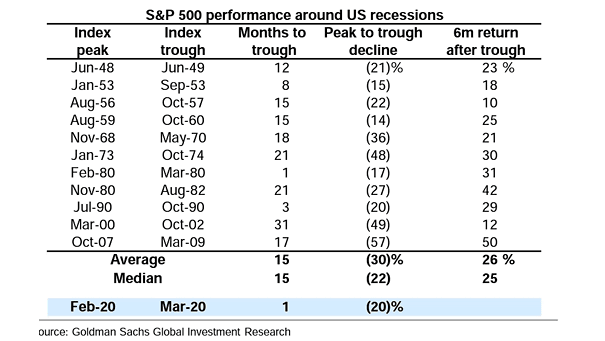
S&P 500 Performance Around U.S. Recessions The performance of the S&P 500 around U.S. recessions is -30% on average. Image: Goldman Sachs Global Investment Research
S&P 500 Performance Around U.S. Recessions The performance of the S&P 500 around U.S. recessions is -30% on average. Image: Goldman Sachs Global Investment Research
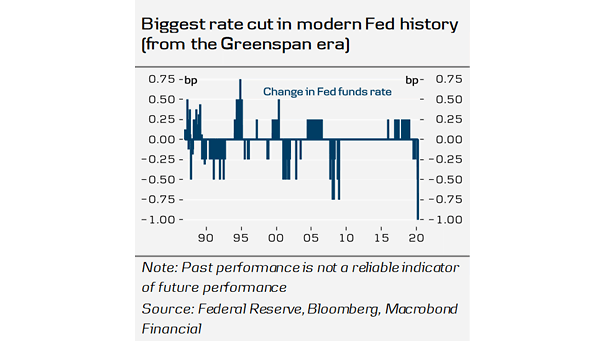
Change in Fed Funds Rate The Fed has cut rates by 100 bps to 0.00-0.25%. This is the biggest rate cut in modern times. Image: Danske Research
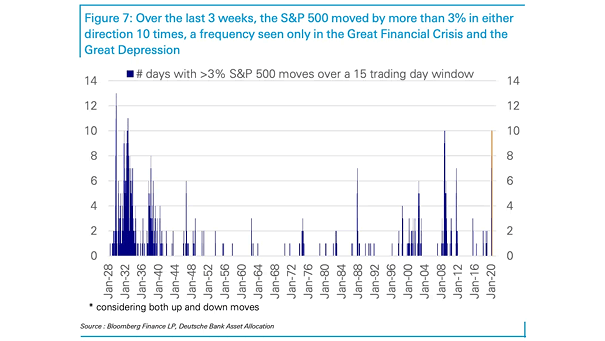
Volatility – Number of Days with >3% S&P 500 Moves over a 15 Trading Day Window The S&P 500’s volatility is similar to the Great Financial Crisis and the Great Depression. Image: Deutsche Bank Asset Allocation
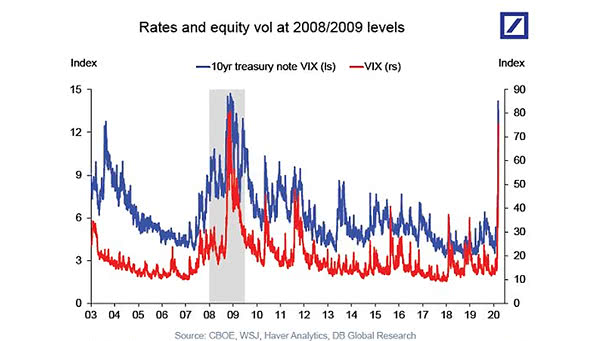
Rates and Equity Volatility (VIX) This chart highlights the significant and sudden spike in rates and equity volatility at 2008/2009 levels. Image: Deutsche Bank Global Research
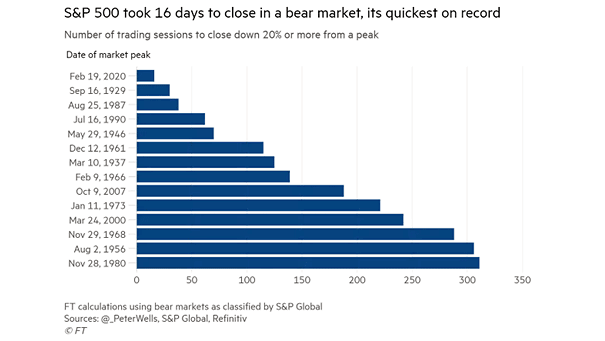
S&P 500 and Number of Trading Sessions to Close Down 20% or More from a Peak The S&P 500 experiences its fastest fall into bear market in history. Image: Financial Times
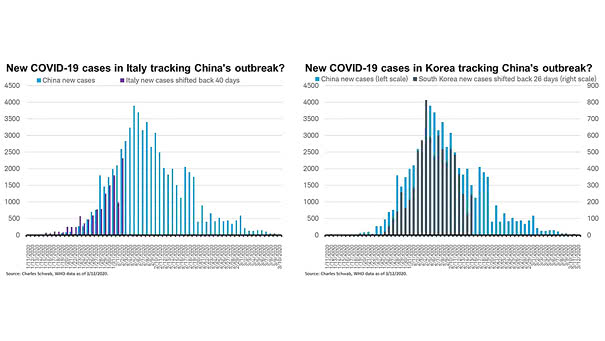
New Coronavirus Cases in Italy and South Korea These charts suggests that new coronavirus cases in Italy and South Korea are still tracking China’s outbreak. Image: Charles Schwab
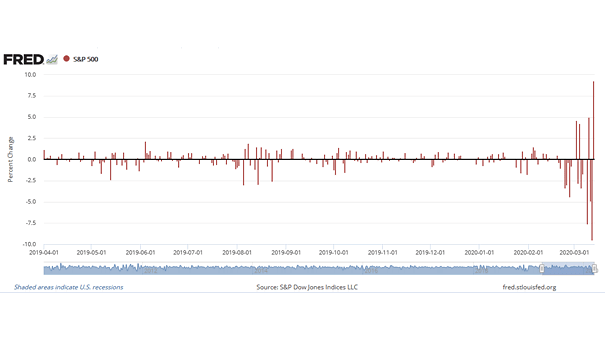
Volatility – Daily Changes in the S&P 500 Index Market volatility is rising with coronovirus fear. This chart puts daily changes in the S&P 500 Index into perspective.
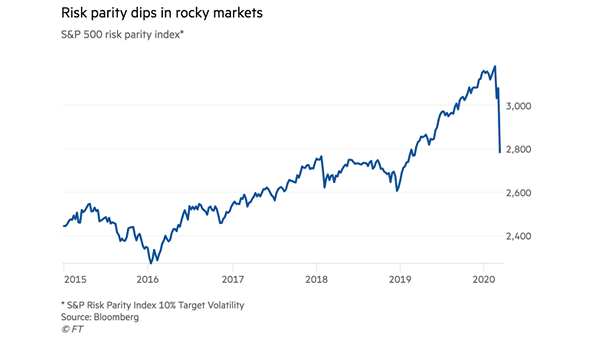
S&P 500 Risk Parity Index Risk parity funds experience their worst week since 2008, by the decline of U.S. Treasury bonds and equities. Image: Financial Times
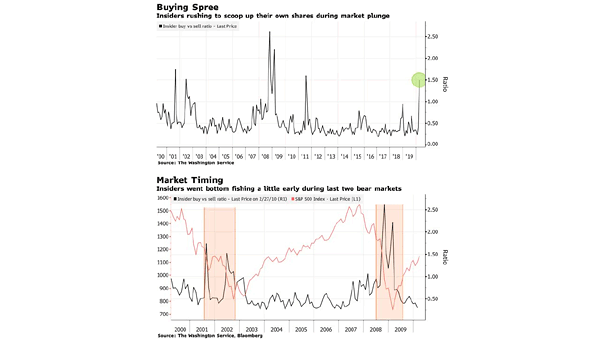
Insider Buy vs. Sell Ratio and S&P 500 Insider buying is at its highest level in nine years, but recent history shows that insiders tend to be early in picking the bottom. Image: Bloomberg
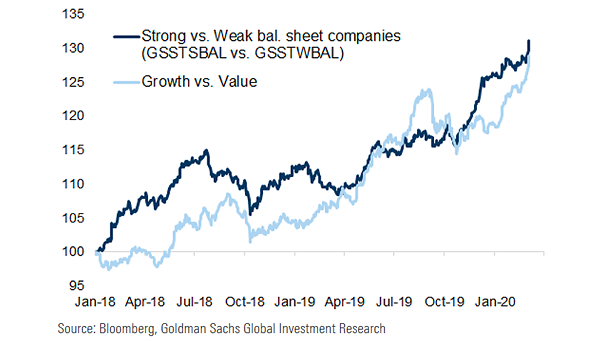
Strong vs. Weak Balance Sheet Companies and Growth vs. Value Chart showing the good correlation between strong vs. weak balance sheet companies and growth vs. value. Image: Goldman Sachs Global Investment Research
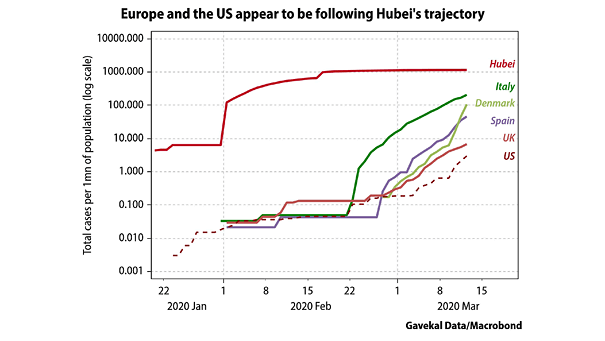
Coronavirus – Europe and U.S. vs. Hubei This chart suggests that coronavirus cases in Europe and the U.S. are following Hubei’s trajectory. A turning point is not expected rapidly. Image: Gavekal, Macrobond