Fear & Greed Index
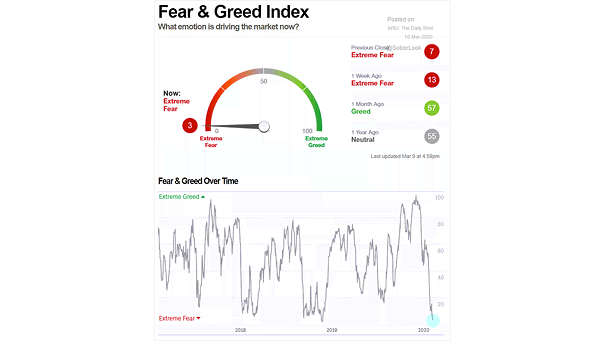
Fear & Greed Index The Fear & Greed Index drops to extreme fear levels. Is this a market bottom signal? Image: Cable News Network
Fear & Greed Index The Fear & Greed Index drops to extreme fear levels. Is this a market bottom signal? Image: Cable News Network
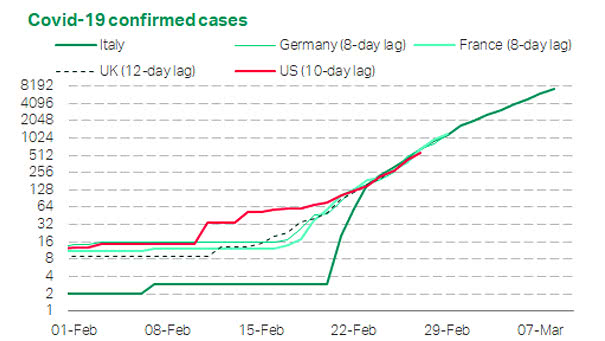
Coronavirus Confirmed Cases This chart suggests that in 10 days, the United States will have the same COVID-19 confirmed cases as Italy today. Image: TS Lombard
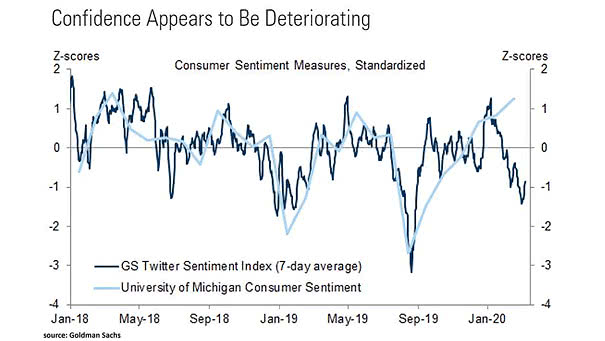
Twitter Sentiment Index and University of Michigan Consumer Sentiment The Goldman Sachs Twitter Sentiment Index suggests that U.S. consumer sentiment appears to be deteriorating. Image: Goldman Sachs Global Investment Research
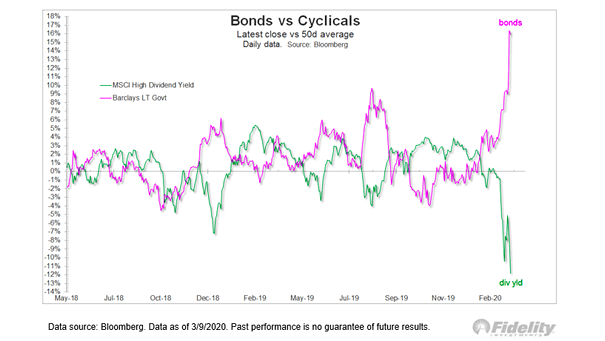
Bonds vs. Cyclicals This chart shows that the dispersion between bonds and cyclicals is very extended. Image: Fidelity Investments
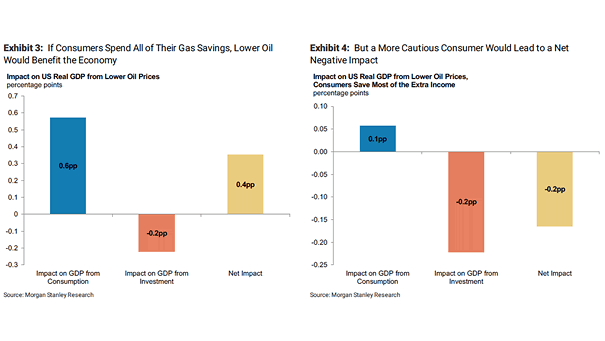
Impact on U.S. Real GDP from Lower Oil Prices More cautious consumers would lead a net negative impact on overall GDP growth Image: Morgan Stanley Research
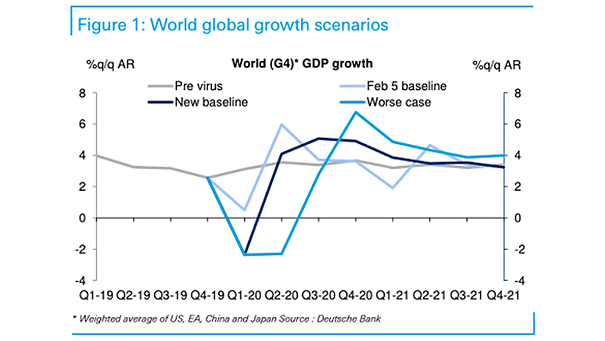
Global GDP Growth Scenarios Deutsche Bank expects two quarters of global negative growth in 2020. Image: Deutsche Bank
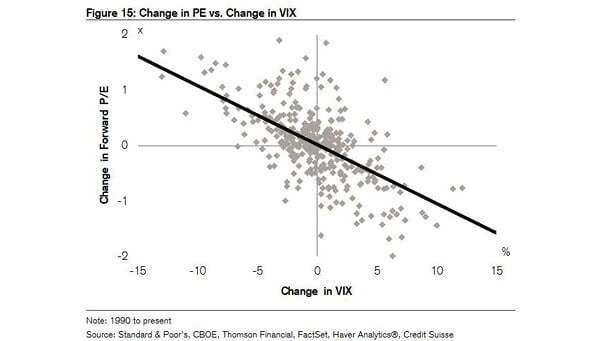
Change in P/E vs. Change in VIX Higher volatility suggests lower multiples. Image: Credit Suisse
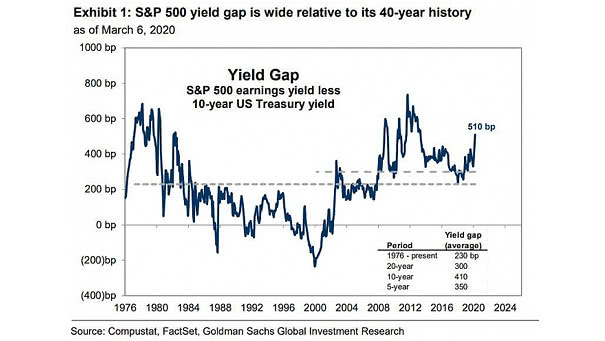
S&P 500 Earnings Yield Less 10-Year U.S. Treasury Yield Goldman Sachs expects the yield gap will narrow to 395 bp by the end of the year. Image: Goldman Sachs Global Investment Research
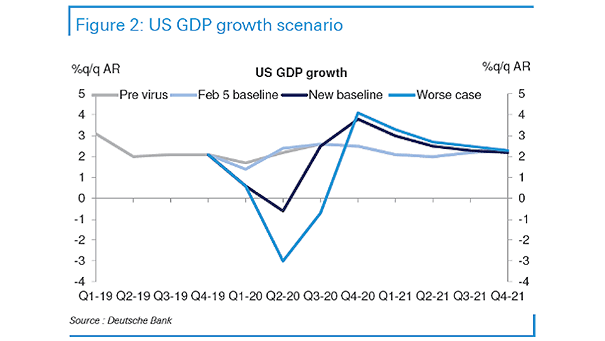
U.S. GDP Growth Scenario Chart suggesting that U.S. GDP could improve significantly in the fourth quarter of 2020. Image: Deutsche Bank
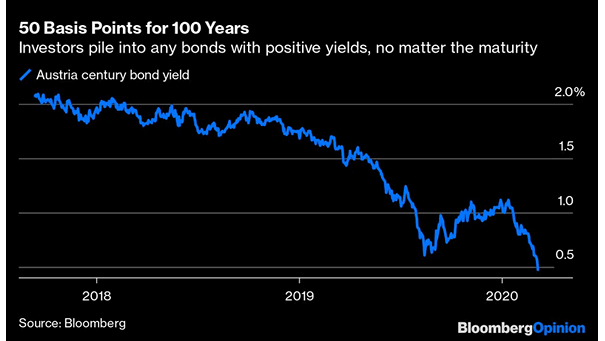
Austria Century Bond Yield Austria century bond yield plunges as coronavirus fears intensify. Image: Bloomberg
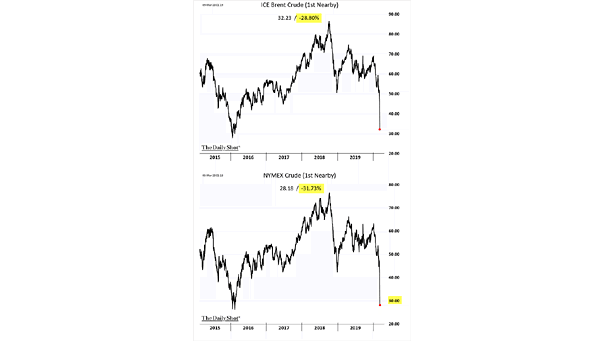
ICE Brent Crude Oil Price and NYMEX Crude Oil Price Oil price plummets, as OPEC+ failed to agree production cuts. Image: The Daily Shot