Equity Market Reaction to Improvement in Outbreak
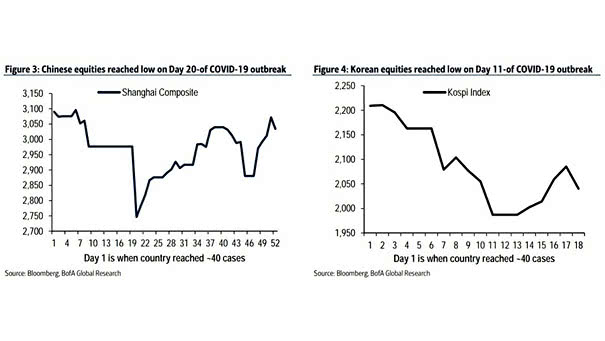
Equity Market Reaction to Improvement in Outbreak Charts showing that the low for equities in China was reached on Day 20, and in Korea on Day 11. Image: BofA Global Research
Equity Market Reaction to Improvement in Outbreak Charts showing that the low for equities in China was reached on Day 20, and in Korea on Day 11. Image: BofA Global Research
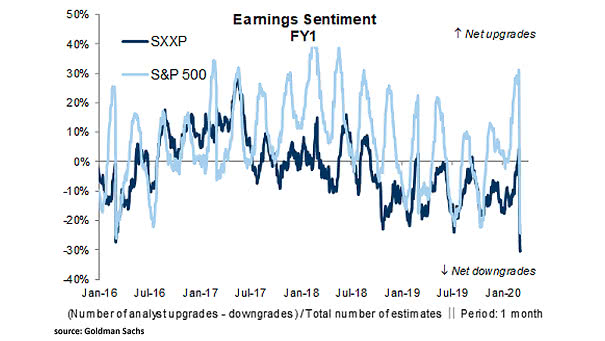
Earnings Sentiment Chart showing unusually low levels of earnings sentiment. Image: Goldman Sachs Global Investment Research
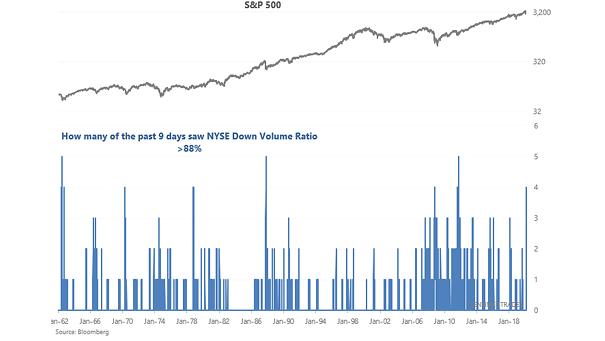
S&P 500 and NYSE Down Volume Ratio Four of the past nine days have seen NYSE down volume ratio above 88%. Historically, the S&P 500 rallied every time over the next year, with a median return of 24.3% since 1962. Image: Sentimentrader
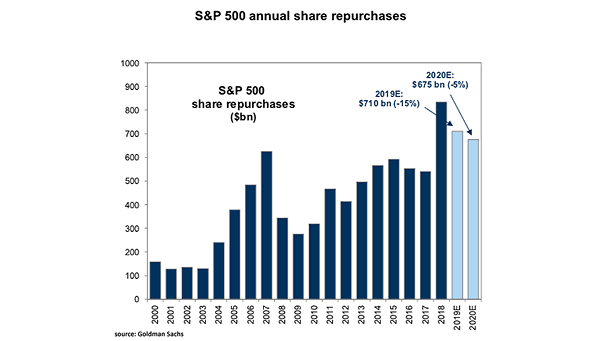
Buybacks – S&P 500 Annual Share Repurchases Goldman Sachs expects stock buybacks among S&P 500 companies to drop 5% to $675 billion this year. Image: Goldman Sachs Global Investment Research
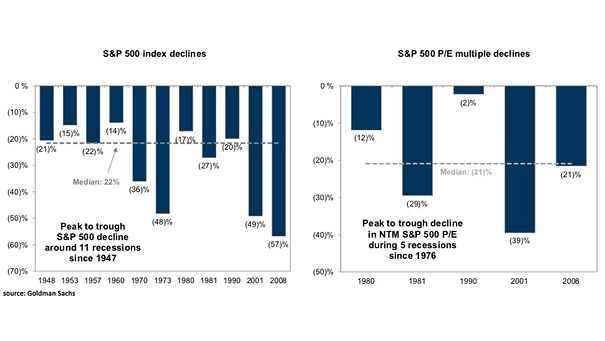
S&P 500 Decline and P/E Change in Recessions Historically, following a recession, the S&P 500 fall by a median of 22% from peak to trough and S&P multiples contract by a median of 21%. Image: Goldman Sachs Global Investment Research
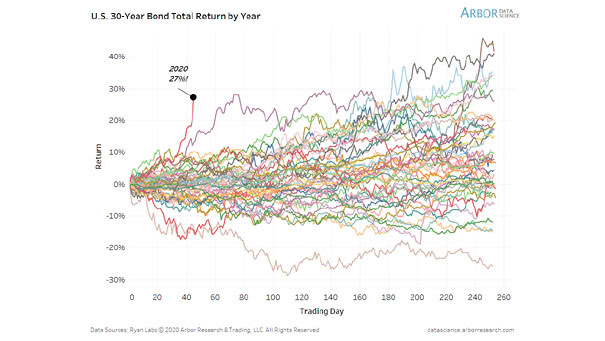
U.S. 30-Year Bond Total Return by Year U.S. long-bond yield hits all-time low, with the world in crisis mode. Image: Arbor Research & Trading LLC
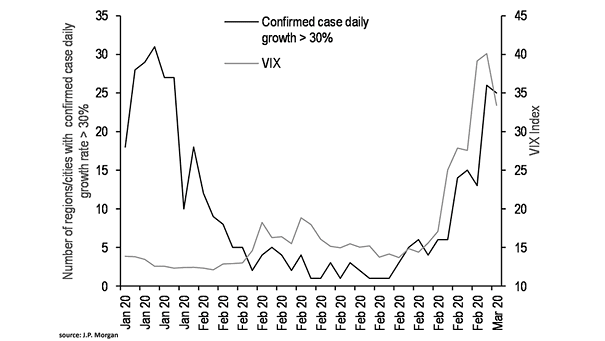
VIX and Number of Regions/Cities with Confirmed Coronavirus Case Daily Growth Rate Above 30% This chart shows the correlation between VIX and the number of regions/cities with confirmed coronavirus case daily growth rates above 30%. Image: J.P. Morgan
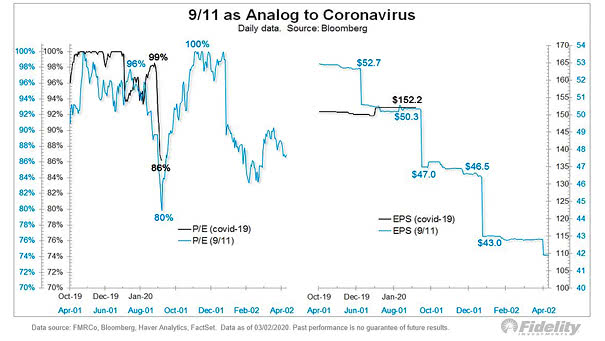
U.S. Stock Market – 9/11 as Analog to Coronavirus This chart compares 9/11 to coronavirus. It shows the P/E ratio as a percentile, and EPS. Image: Fidelity Investments
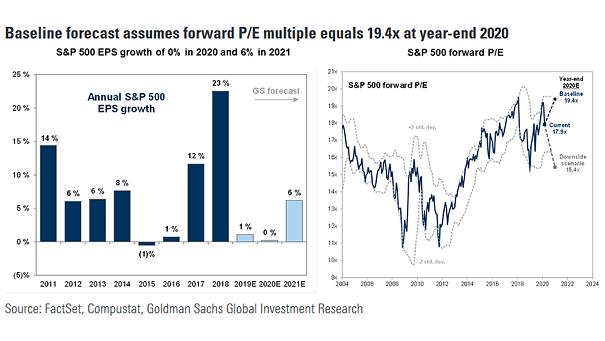
Annual S&P 500 EPS Growth and S&P 500 Forward P/E Goldman’s baseline scenario suggests S&P 500 EPS growth of 0% in 2020 and forward P/E multiple equals 19.4x at year-end 2020. Image: Goldman Sachs Global Investment Research
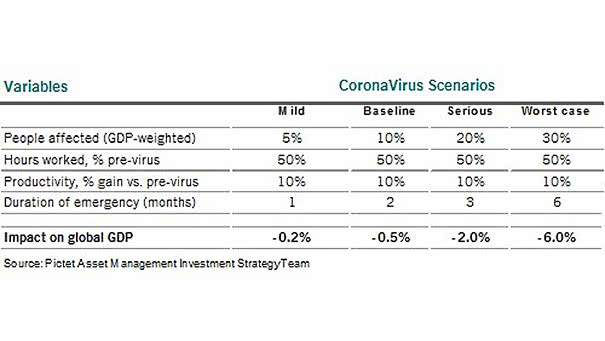
Coronavirus Scenarios and Impact on Global GDP This table suggests the impact of the coronavirus on global GDP. Image: Pictet Asset Management
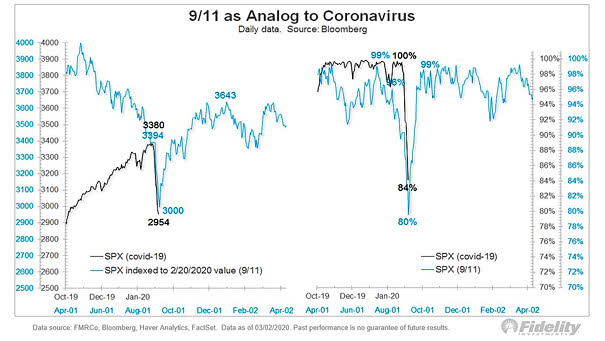
S&P 500 – 9/11 Analog to Coronavirus The chart shows the S&P 500 index in 2001 indexed to the S&P 500 today. In 2001, the stock market bounced back strongly. Image: Fidelity Investments