High Yield Spread to Worst
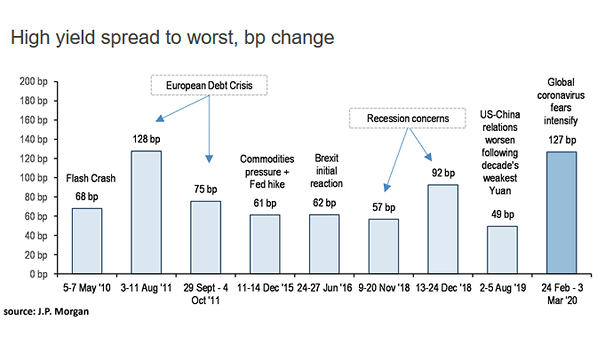
High Yield Spread to Worst Is the panic over for high-yield bond investors, as global coronavirus fears intensify? Image: J.P. Morgan
High Yield Spread to Worst Is the panic over for high-yield bond investors, as global coronavirus fears intensify? Image: J.P. Morgan
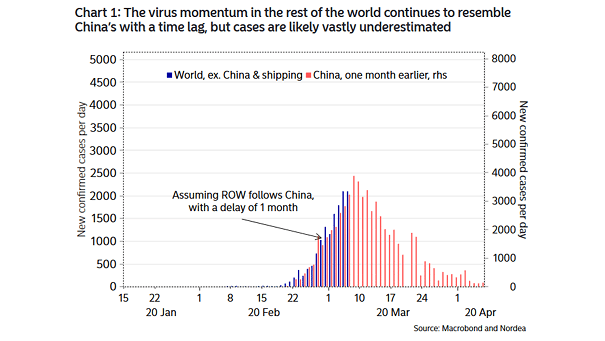
Coronavirus Momentum This chart suggests that the coronavirus momentum may fade next week, as the daily new coronavirus cases outside of China resemble the Chinese outbreak with a lag of one month. Image: Nordea and Macrobond
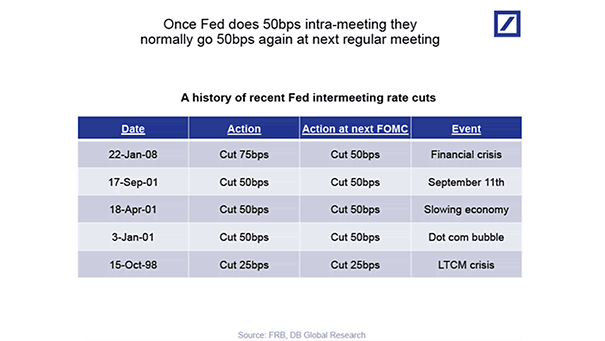
A History of Recent Fed Intermeeting Rate Cuts In recent history, once the Fed does 50bps emergency rate cut, they normally go 50bps again at next regular meeting. Image: Deutsche Bank Global Research
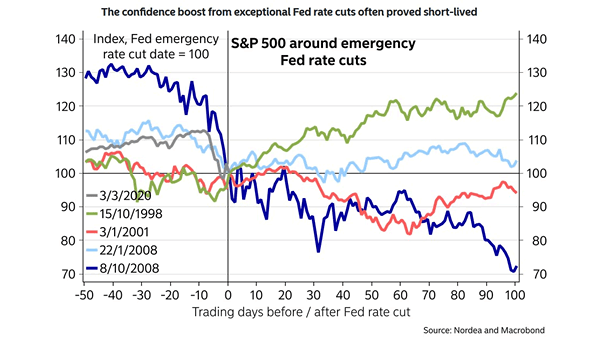
S&P 500 Around Emergency Fed Rate Cuts In recent history, the performance of the S&P 500 has been mixed after emergency Fed rate cuts. Image: Nordea and Macrobond
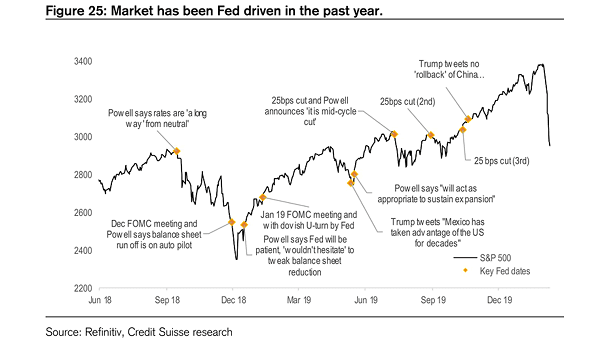
S&P 500 and Key Fed Dates Chart showing that the U.S. stock market has been Fed driven in the past year. Image: Credit Suisse Research
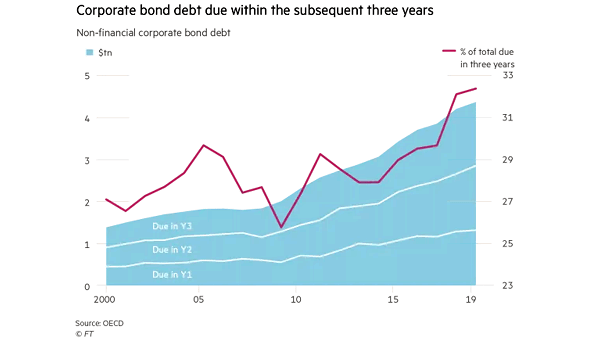
Non-Financial Corporate Bond Debt Chart showing the corporate bond debt due within the subsequent three years. Is this where the next debt crisis will begin? Image: Financial Times
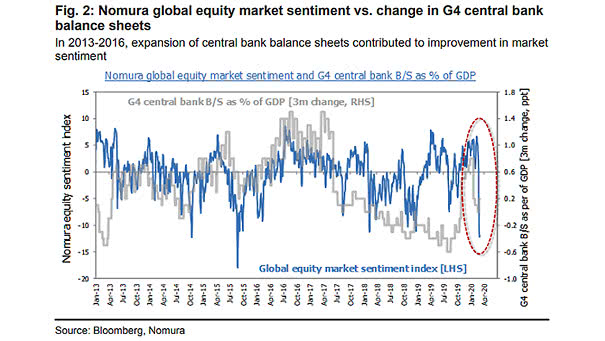
Global Equity Market Sentiment vs. Change in G4 Central Bank Balance Sheets In 2013 and 2016, the expansion of central bank balance sheets contributed to improved market sentiment. Image: Nomura
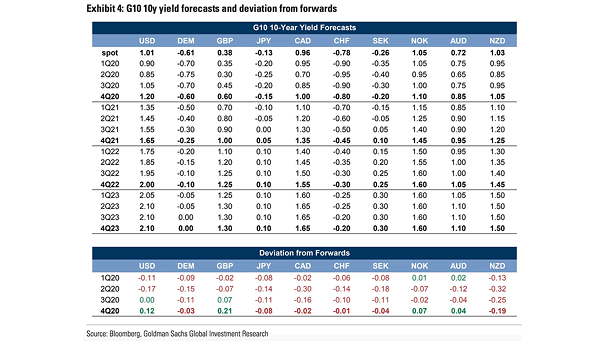
G10 10-Year Yield Forecasts and Deviation from Forwards Goldman Sachs has lowered its G10 10-year yield forecasts, due to the coronavirus outbreak. Image: Goldman Sachs Global Investment Research
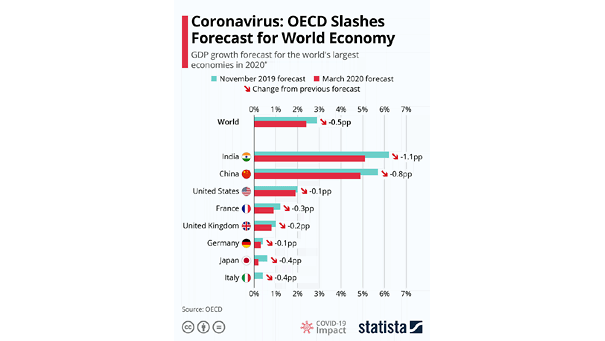
GDP Growth Forecast for the World’s Largest Economies in 2020 The OECD expects the world economy to grow by 2.4% in 2020. Image: Statista
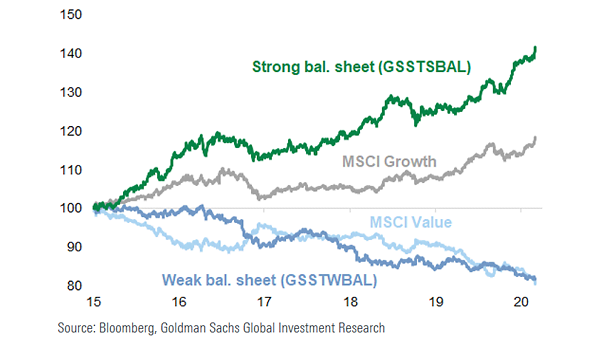
Companies with Strong Balance Sheet vs. Companies with Weak Balance Sheet Companies with strong balance sheet have outperformed companies with weak balance sheet. Typically, companies with weak balance sheet invest less. Image: Goldman Sachs Global Investment Research
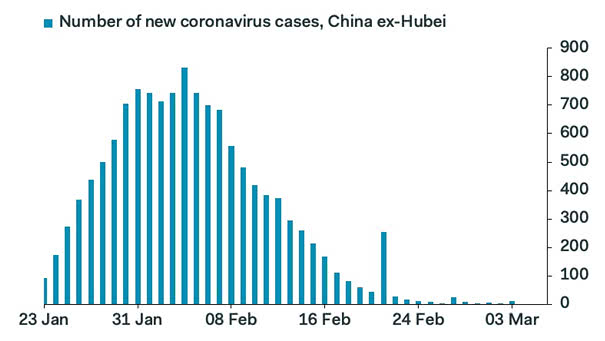
Number of New Coronavirus Cases, China ex-Hubei A continued decline in the number of new coronavirus cases from China ex-Hubei province is encouraging. Image: Pantheon Macroeconomics