Tourism as a Share of GDP in Different Countries
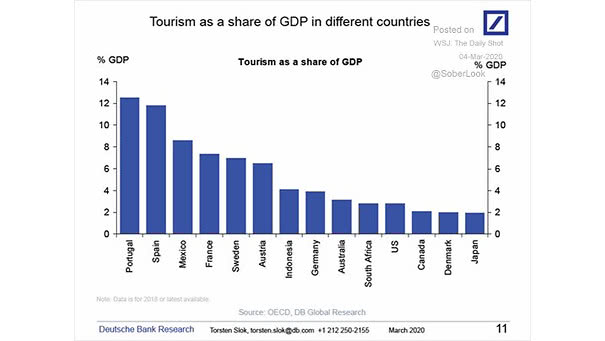
Tourism as a Share of GDP in Different Countries The spread of coronavirus in Europe could affect its tourism industry. Image: Deutsche Bank Global Research
Tourism as a Share of GDP in Different Countries The spread of coronavirus in Europe could affect its tourism industry. Image: Deutsche Bank Global Research
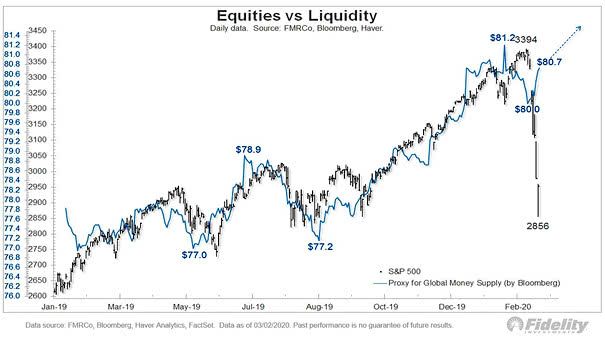
S&P 500 and Global Money Supply Chart suggesting that global money supply tends to push U.S. equities higher. Image: Fidelity Investments
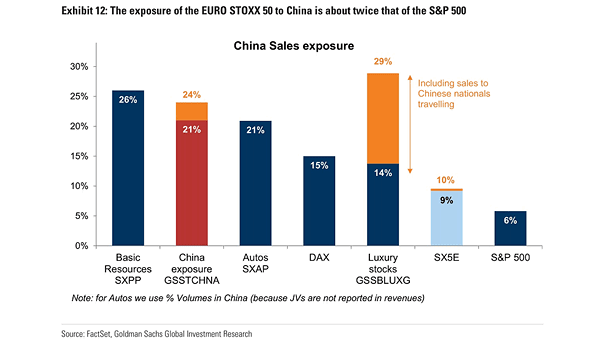
China Sales Exposure – Euro Stoxx 50 vs. S&P 500 Europe equities are more sensitive than the U.S. market, as the exposure of the Euro Stoxx 50 index to China is about twice that of the S&P 500. Image: Goldman Sachs Global Investment Research
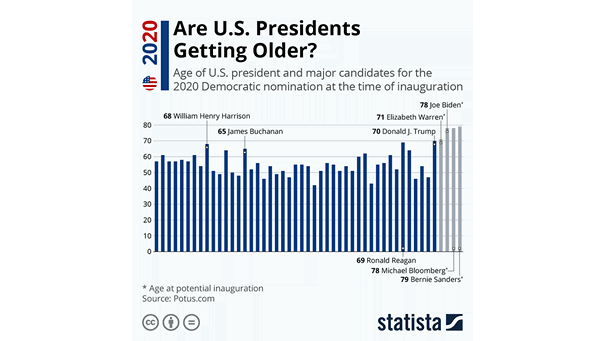
Age of U.S. President and Major Candidates for the 2020 Democratic Nomination at the Time of Inauguration How old is too old to be president in the United States? Image: Statista
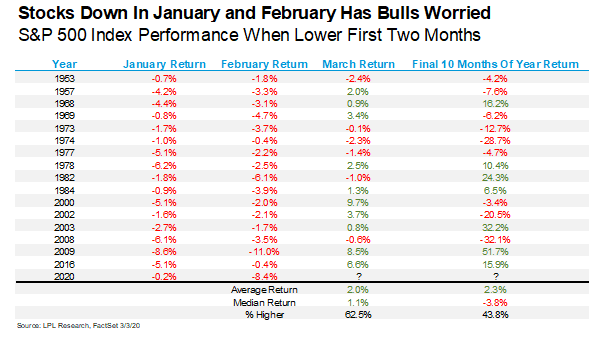
S&P 500 Index Performance When Lower First Two Months Historically, when the S&P 500 index was down in January and February, the entire year was down almost 5% on average. Image: LPL Research
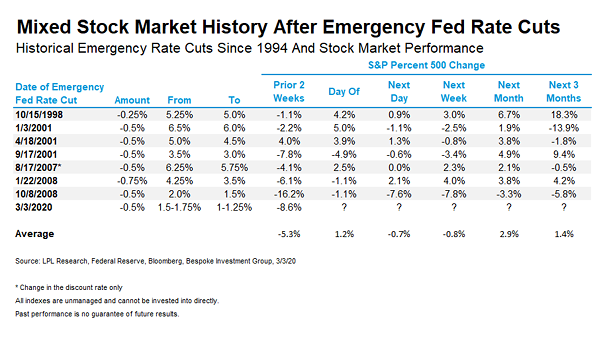
Historical Emergency Rate Cuts since 1994 and Stock Market Performance After emergency rate cuts, the table shows that the performance of the S&P 500 has been mixed. Image: LPL Research
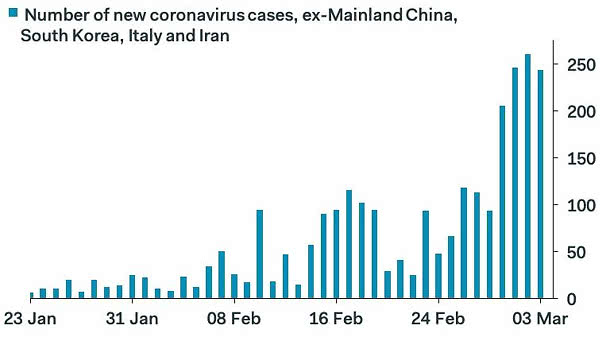
Number of New Coronavirus Cases, Ex-Mainland China, South Korea, Italy and Iran Chart suggesting that the growth of new coronavirus cases, ex-Mainland China, South Korea, Italy and Iran aren’t accelerating. Image: Pantheon Macro
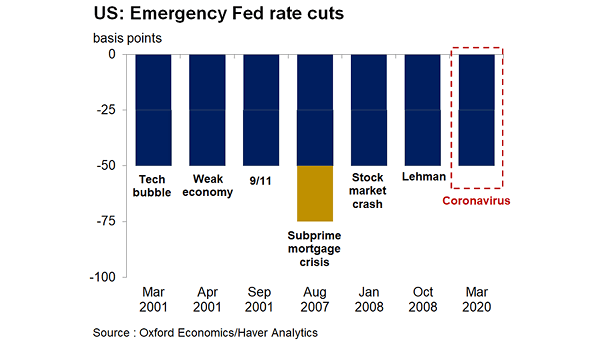
U.S. Emergency Fed Rate Cuts This charts puts the Fed’s emergency rate cut into perspective. Image: Oxford Economics
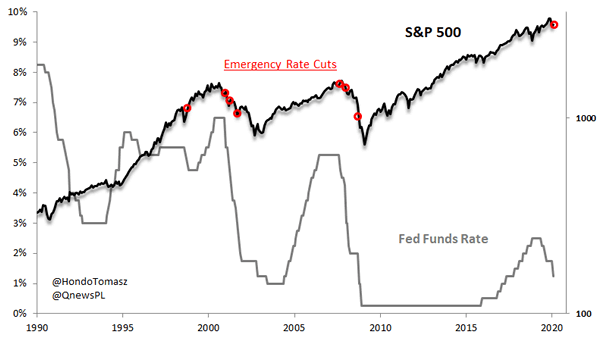
S&P 500 and Emergency Rate Cuts In recent history, emergency rate cuts occurred during or just prior to the decline of the stock market. Image: Hondo Tomasz
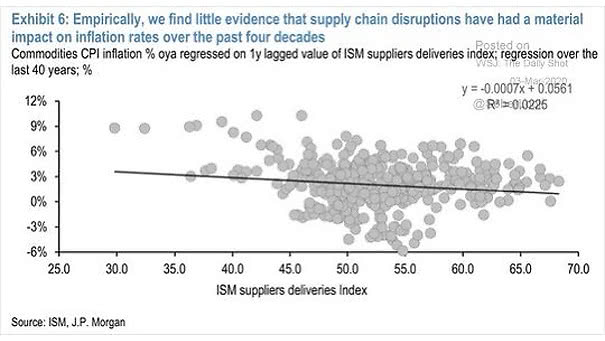
Inflation and Supply Chain Disruptions Chart suggesting that supply chain disruptions have no material impact on inflation. Image: J.P. Morgan
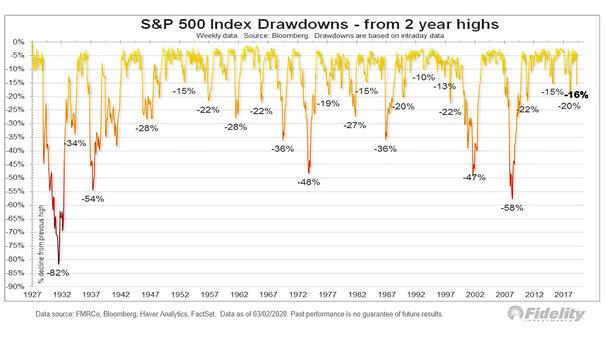
S&P 500 Index Drawdowns From 2 Year Highs The chart shows S&P 500 drawdowns since 1927. Drawdowns don’t have a precise time to start or end and they happen all the time. You may also like “Maximum Intra-Year Drawdown for the S&P 500.” Image: Fidelity Investments