U.S. Bond Yields vs. S&P 500 Multiples
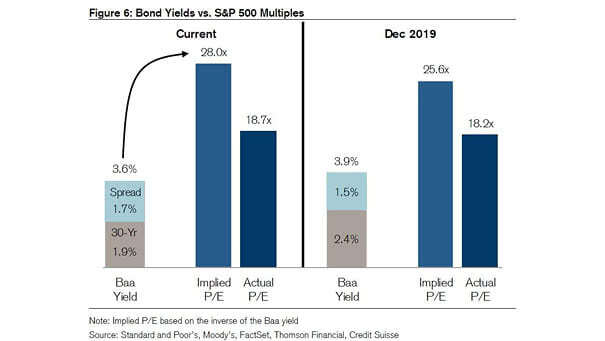
U.S. Bond Yields vs. S&P 500 Multiples This chart suggests that lower bond yields imply higher S&P 500 multiples. Image: Credit Suisse
U.S. Bond Yields vs. S&P 500 Multiples This chart suggests that lower bond yields imply higher S&P 500 multiples. Image: Credit Suisse
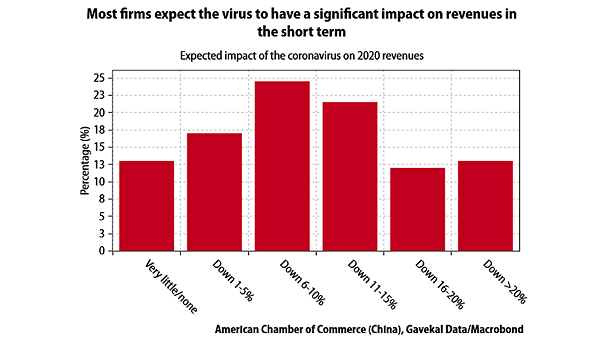
Expected Impact of the Coronavirus on 2020 Revenues Chart suggesting the revenue impact from the coronavirus in 2020. Image: Gavekal, Macrobond
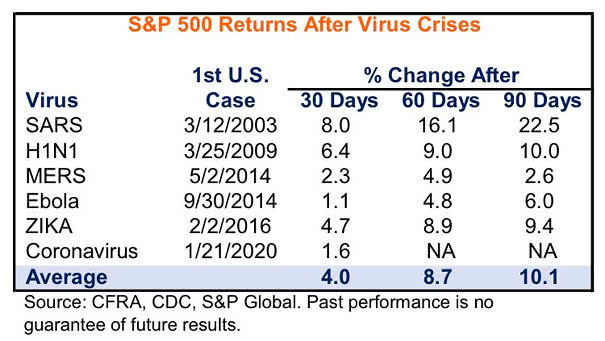
S&P 500 Returns After Virus Outbreaks This chart shows how the S&P 500 has performed after viral outbreaks. Image: CFRA Research
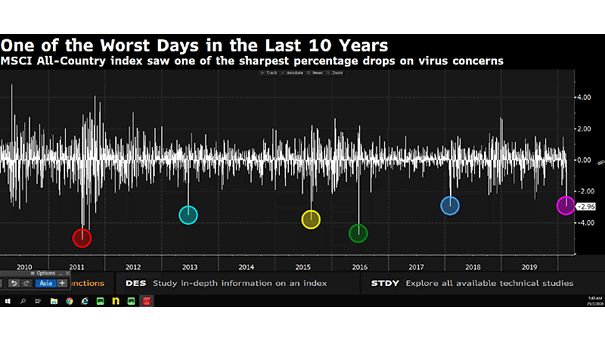
MSCI All-Country Index and Percentage Drops on Virus Concerns Yesterday, global stocks had one of the worst days in the last 10 years. Image: Bloomberg
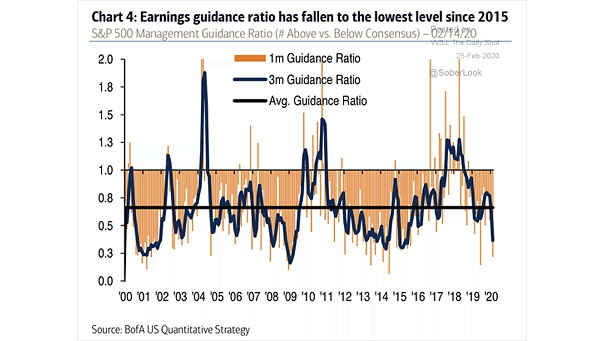
S&P 500 Management Guidance Ratio The S&P 500 earnings guidance ratio has been declining to its lowest level since 2015. Image: BofA US Quantitative Strategy
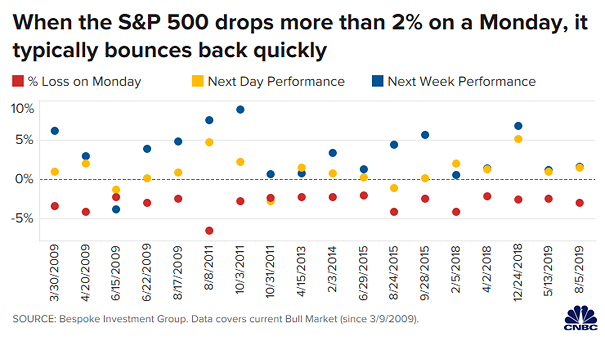
S&P 500 Drops More than 2% on a Monday Drops of more than 2% on a Monday have historically been bought in the near term. Image: CNBC
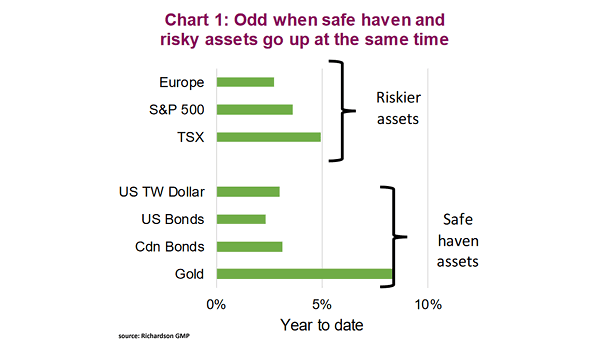
Risky Assets and Safe Haven Assets Risky and safe haven assets usually don’t move in the same direction. Image: Richardson Wealth
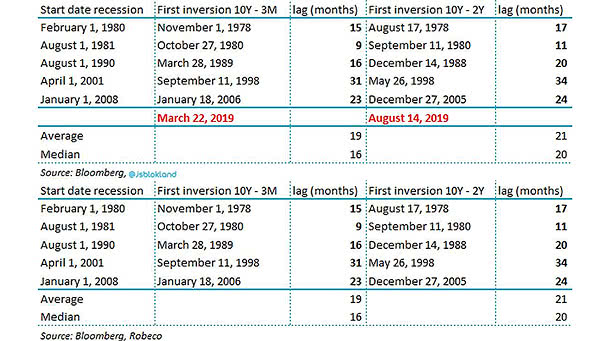
Yield Curve Inversions and U.S. Recessions The table shows the significant lag between the first inversion date and the onset of the recession in the United States. Image: Jeroen Blokland
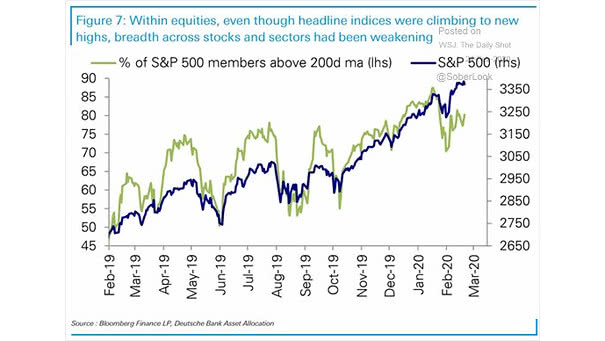
% of S&P 500 Members Above 200-Day Moving Average This chart shows that breadth across stocks and sectors had been weakening, even though the S&P 500 was climbing to new highs. Image: Deutsche Bank Asset Allocation
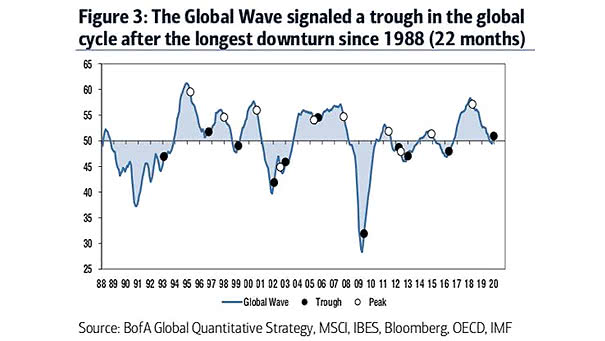
Global Cycle The global wave suggests a trough in the global cycle. Image: BofA Global Quantitative Strategy
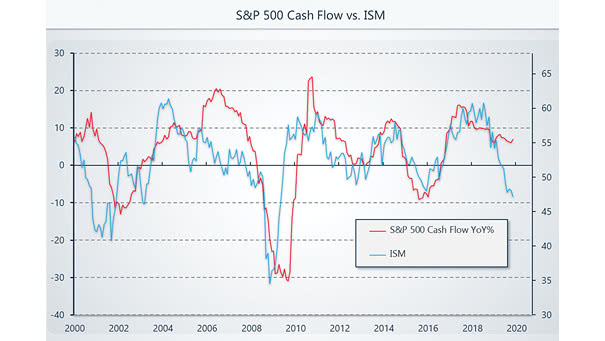
ISM Manufacturing Index vs. S&P 500 Cash Flow Chart showing the correlation between S&P 500 cash flow and the ISM Manufacturing Index. Image: Raoul Pal