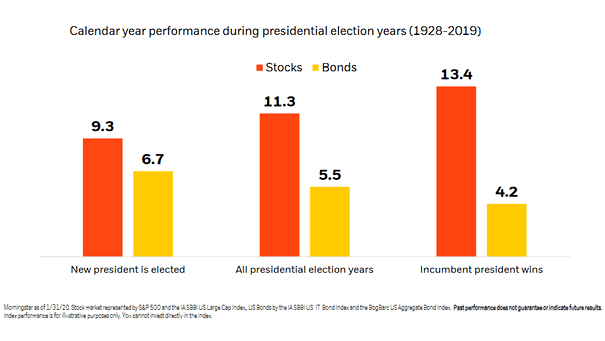
Number of Months U.S. Economy in Recession
Number of Months U.S. Economy in Recession The 2010s are the first time a decade has gone without the U.S. falling into recession. Image: Deutsche Bank Global Research
Number of People Infected with Coronavirus Uncertainty remains high, but the latest number of infections shows a slowdown in spread of coronavirus. Image: Danske Research
China’s Trade Balance by Country China exports $2.5 trillion worth of goods to other countries and has a trade balance of $367 billion. Image: howmuch.net
S&P 500 Total Return Index and U.S. High Yield/High Grade Chart suggesting a bullish market that is getting stretched and vulnerable. Image: BofA Global Investment Strategy
China 10-Year Yield and Copper to Gold Ratio Chart showing the weekly correlation between China 10-year yield and the copper to gold ratio (R² = 0.58). Image: Bloomberg
Financial Stress Index and Financial Conditions Index If financial conditions tighten sharply, this suggests a coming slowdown or recession. Currently, the St. Louis Financial Stress Index and the Chicago Fed National Financial Conditions Index are at lowest and below zero. The average value of the St. Louis Financial Stress Index is designed to be zero since…
U.S. Output Gap (% of potential GDP) and Inflation U.S. output gap (% of potential GDP) tends to lead underlying core PCE by 12 months. Image: Pictet Asset Management
Inequality – Concentration of Equities Ownership by Wealth Class in the U.S. The top 1% of households owns equities, while the bottom 50% of households owns real estate. Image: Goldman Sachs Global Investment Research
S&P 500 Performance and Global Viral Outbreaks This chart highlights the S&P performance through prior global viral outbreaks. Image: Truist
Inequality – Net Saving by Wealth Class in the U.S. This chart shows that the savings rate for the bottom 90% of the U.S. population is negative since the 1990s. Image: Deutsche Bank Global Research
Valuation – S&P 500 Forward P/E Ratio Chart showing that the forward P/E ratio of the S&P 500 remains at high level, above its historical range. Image: Fidelity Investments