U.S. Sources of Federal Tax Revenue since 1940
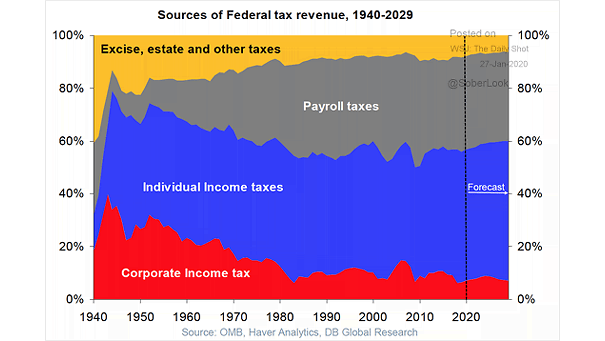
U.S. Sources of Federal Tax Revenue since 1940 This chart puts into perspective the U.S. sources of federal tax revenue since 1940. Image: Deutsche Bank Global Research
U.S. Sources of Federal Tax Revenue since 1940 This chart puts into perspective the U.S. sources of federal tax revenue since 1940. Image: Deutsche Bank Global Research
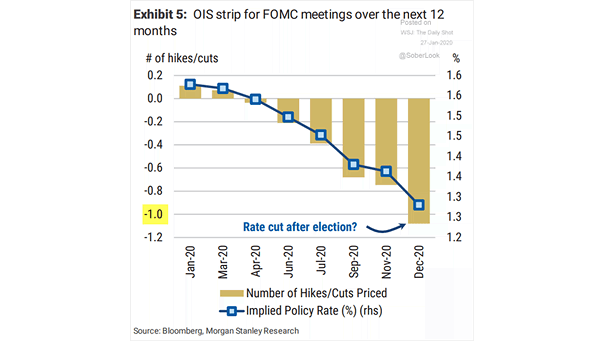
Fed Rate Cut – Overnight Indexed Swaps (OIS) Strip for FOMC Meetings over the Next 12 Months Traders see one more Fed interest rate cut this year. Image: Morgan Stanley Research
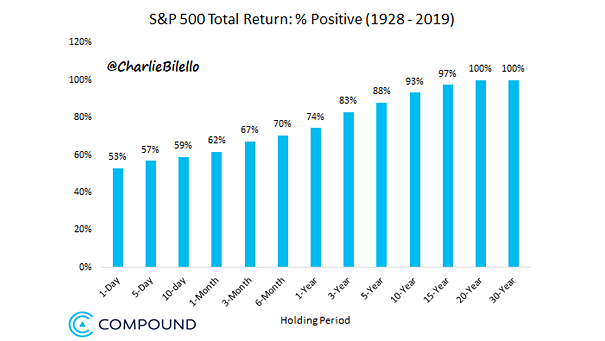
S&P 500 Total Return: % Positive Chart suggesting that increasing the holding period increases the likelihood of success. Image: Compound Capital Advisors, LLC
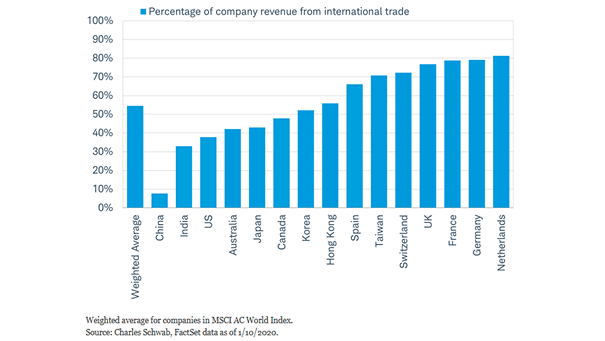
Percentage of Company Revenue from International Trade European companies are highly dependent on foreign markets for their revenues. A rebound in world trade may benefit them directly. Image: Charles Schwab
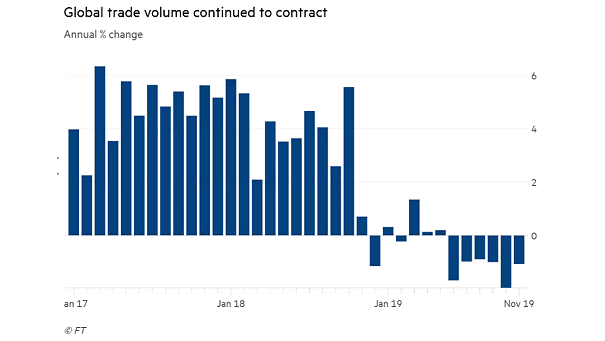
Global Trade Volume Growth in global trade volume is deteriorating at a rapid rate. Image: Financial Times
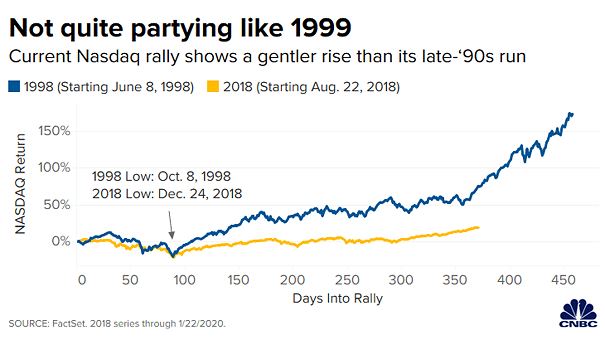
U.S. Stock Market: Nasdaq Rally Chart suggesting that the current Nasdaq rally isn’t a replay of the dotcom bubble Images: CNBC
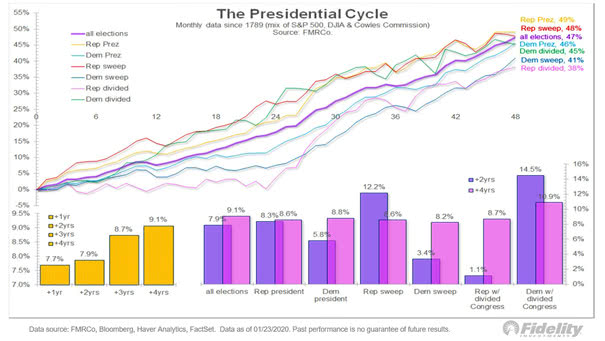
The U.S. Presidential Cycle How U.S. presidential elections affect stock market returns? This chart shows the forward return for the U.S. stock market based on election outcomes. Image: Fidelity Investments
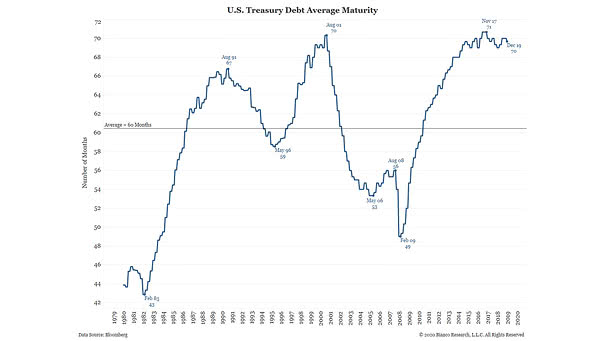
U.S. Treasury Debt Average Maturity The U.S. Treasury debt average maturity has risen since the Great Recession. Image: Bianco Research
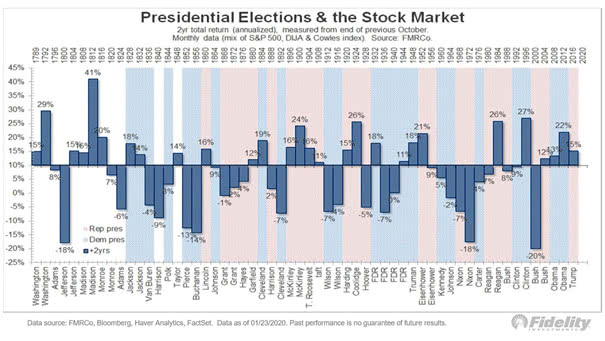
U.S. Presidential Elections and the Stock Market The first two years of presidential terms tend to produce below-average returns, while the next 2 years tend to produce above-average returns. Image: Fidelity Investments
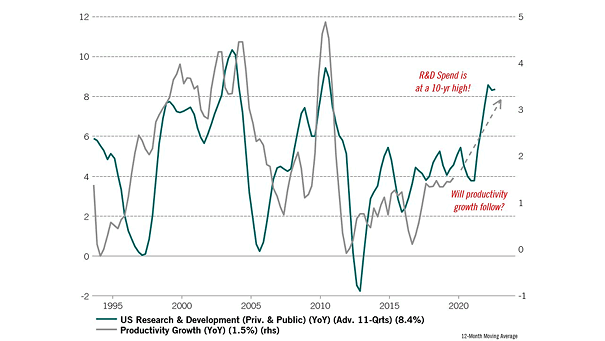
U.S. Research & Development Leads Productivity Growth U.S. Research & Development tends to lead productivity growth by 11 quarters. Image: Pictet Asset Management
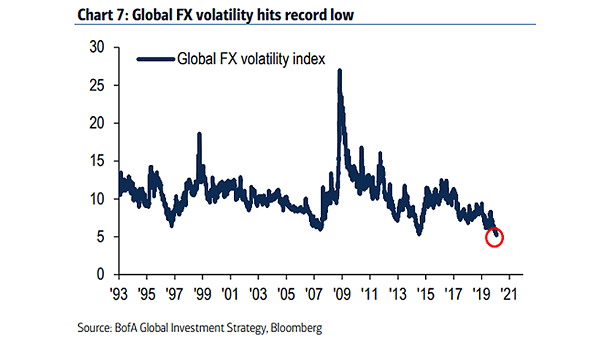
Global FX Volatility In the current environment of low inflation and low interest rates, volatility in foreign exchange markets hits record low. Image: BofA Global Investment Strategy