World Epidemics and Global Stock Market Performance
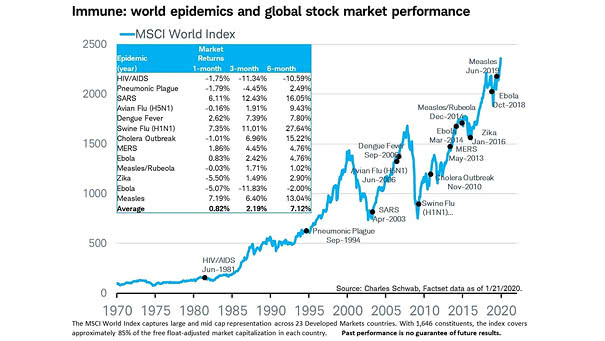
World Epidemics and Global Stock Market Performance Chart showing that the impact of past world pandemics has not been significant on the global stock market. Image: Charles Schwab
World Epidemics and Global Stock Market Performance Chart showing that the impact of past world pandemics has not been significant on the global stock market. Image: Charles Schwab
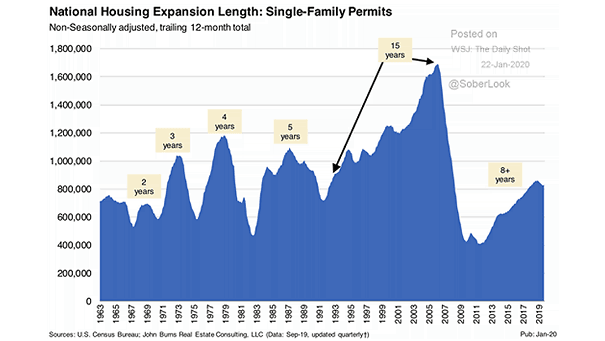
U.S. National Housing Expansion Length The current recovery in housing is in its 9th year. How long will it last? Image: John Burns Real Estate Consulting
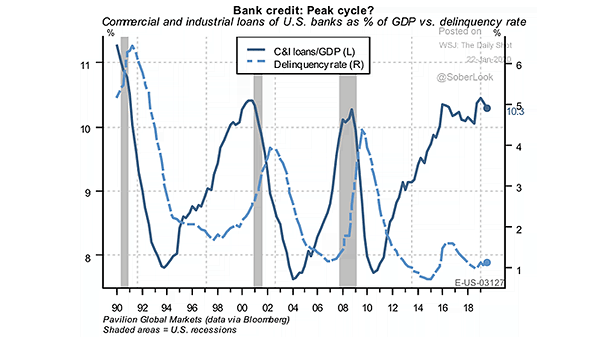
Commercial and Industrial Loans of U.S. Banks as % of GDP vs. Deliquency Rate Is the end of the U.S. credit cycle near? The delinquency rate remains low, while U.S. business loans are close to previous highs. Image: Pavilion Global Markets
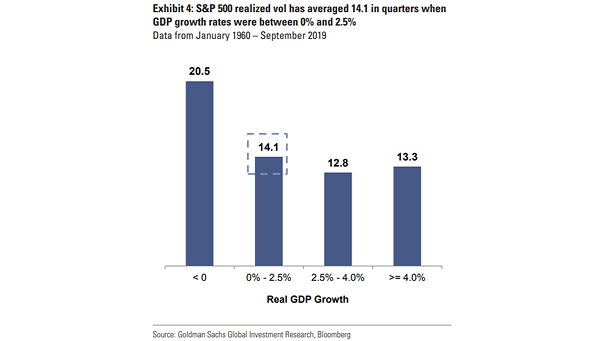
S&P 500 Realized Volatility and U.S. Real GDP Growth Chart suggesting the correlation between the S&P 500 realized volatility and U.S. real GDP growth. Image: Goldman Sachs Global Investment Research
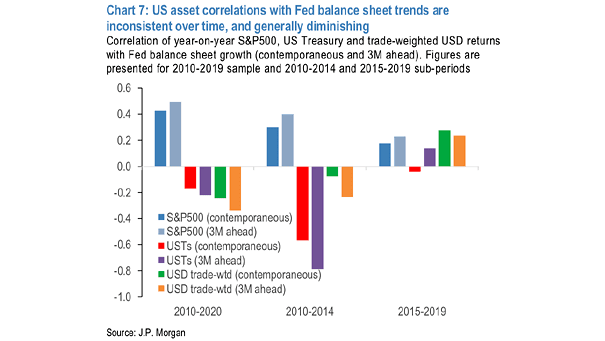
U.S. Asset Correlations and Fed Balance Sheet Trends The correlations between U.S. asset returns and Fed balance sheet growth are generally inconsistent and dimishing over time. Image: J.P. Morgan
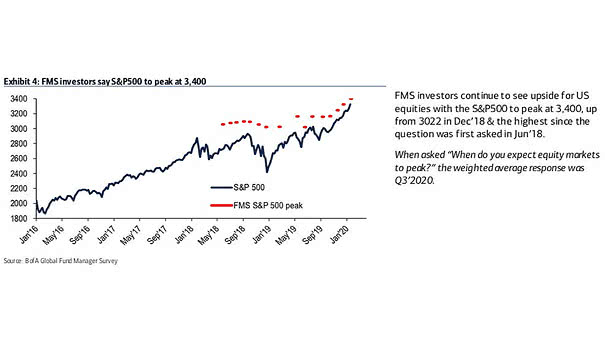
BofA’s Fund Manager Survey Investors and S&P 500 FMS investors expect the S&P 500 to peak at 3,400. Image: BofA Global Fund Manager Survey
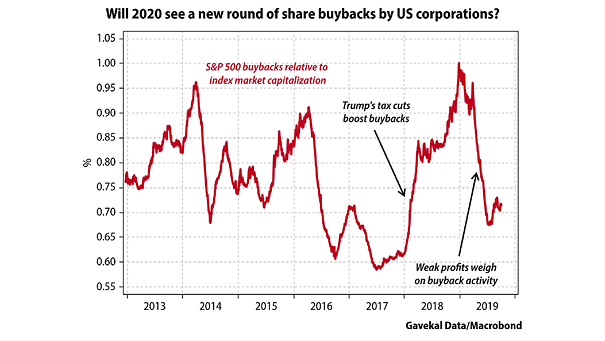
S&P 500 Buybacks Relative to Index Market Capitalization A recovery in corporate earnings could lead to a rebound in buybacks this year. Image: Gavekal, Macrobond
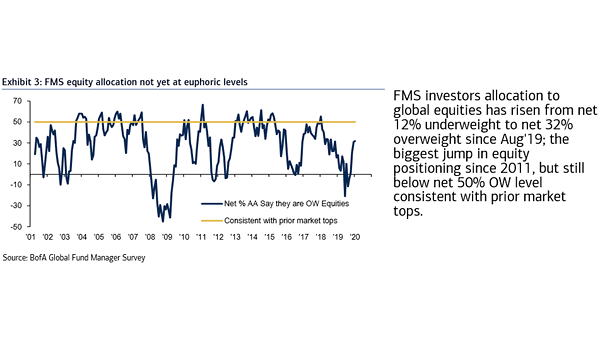
BofA’s Fund Manager Survey Global Equity Allocation FMS investors allocation to global equities is still below 50% level, consistent with prior market tops. Image: BofA Global Fund Manager Survey
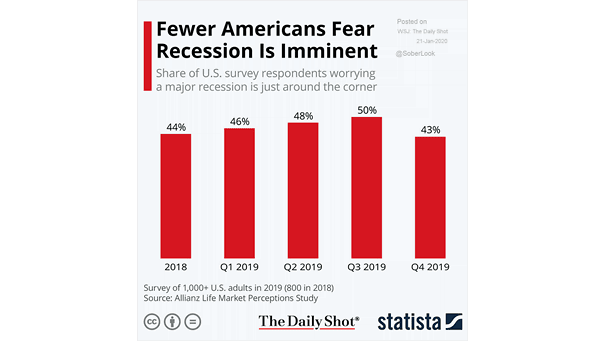
Survey – Fear of Recession in the United States Recession fears recede among Americans. Image: Statista
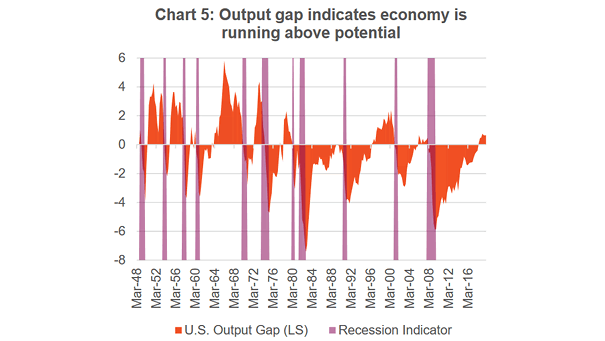
U.S. Output Gap and Inflation This chart shows that actual U.S. GDP is higher than potential GDP. Historically, a positive output gap leads to inflation. Image: Richardson Wealth
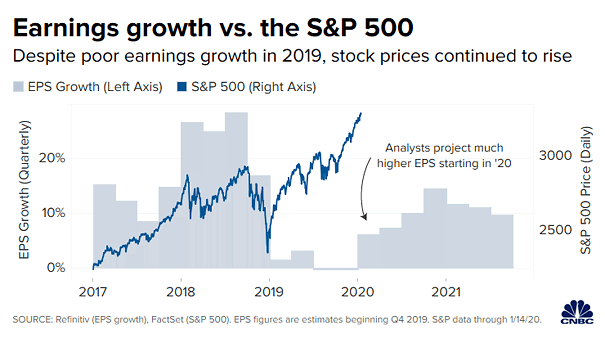
Earnings Growth and S&P 500 Rebound in earnings coming in 2020? Analysts expect a 9.5% jump this year. Image: CNBC