S&P 500 – Performance since 2016 vs. Performance since 2019
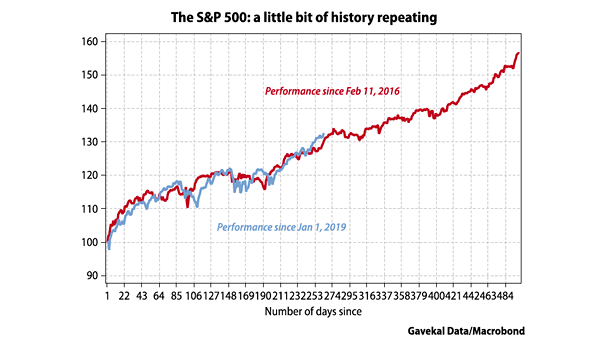
S&P 500 – Performance since 2016 vs. Performance since 2019 The U.S. stock market is on fire. Will history repeat itself? Image: Gavekal, Macrobond
S&P 500 – Performance since 2016 vs. Performance since 2019 The U.S. stock market is on fire. Will history repeat itself? Image: Gavekal, Macrobond
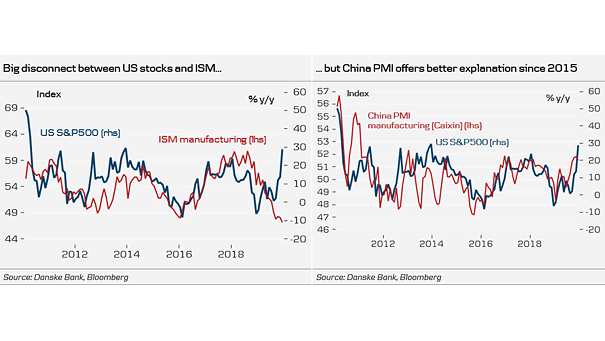
S&P 500 and Caixin China Manufacturing PMI This chart suggests that the relationship between the S&P 500 and the Chinese Manufacturing PMI offers a better explanation since 2015. Image: Danske Bank Research
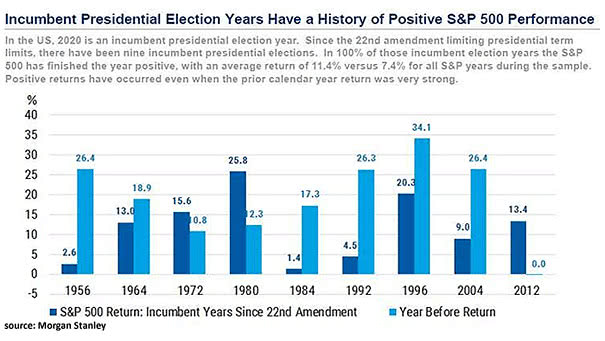
Incumbent Presidential Election Years Since 22nd Amendment Incumbent presidential election years have traditionally been good for equities, with an average return of 11.4% since 22nd amendment. Image: Morgan Stanley Research
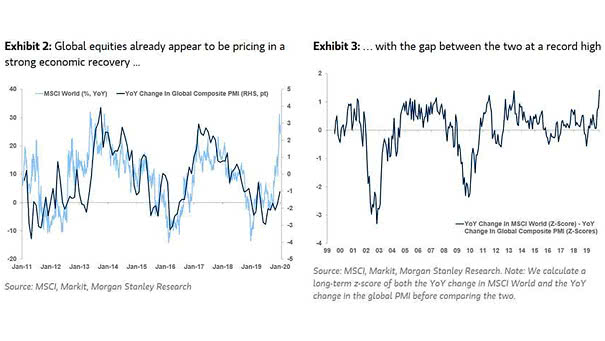
MSCI World vs. Global Composite PMI Global stock markets are very optimistic, as soft and hard indicators suggest that the global slowdown may have bottomed out. Image: Morgan Stanley Research
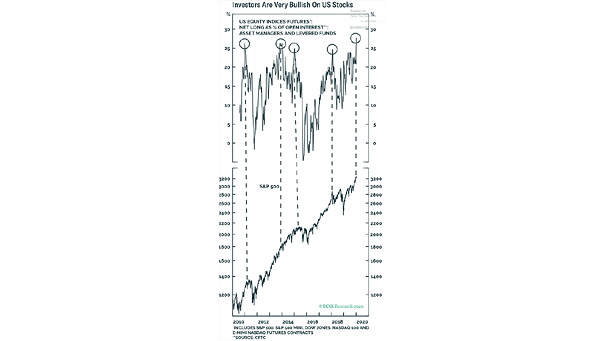
U.S. Equity Indices Futures The U.S. stock market is on fire. Investors have grown extremely bullish. Image: BCA Research
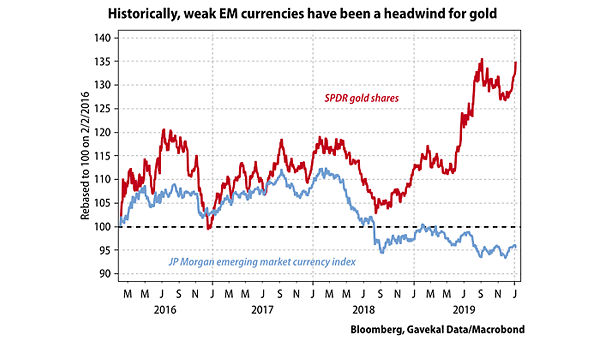
Gold and Emerging Market Currency Index Historically, a weak U.S. dollar tends to be good for gold and emerging markets. Image: Gavekal, Macrobond
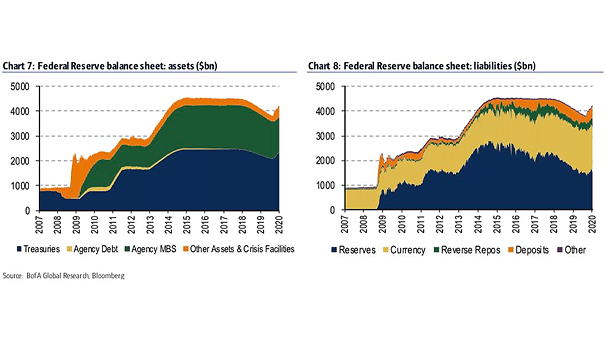
Federal Reserve Balance Sheet: Assets and Liabilities This chart shows the total assets and liabilities of the Federal Reserve. According to the NY Fed, the Fed’s balance sheet could be between $3.8 trillion and $4.7 trillion by 2025. Image: BofA Global Research
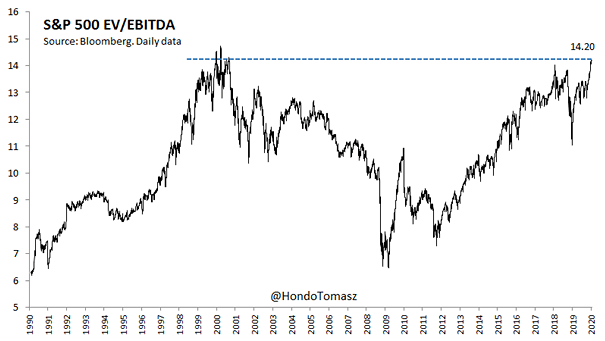
Valuation – S&P 500 EV/EBITDA The EV/EBITDA of the S&P 500 suggests that stocks are as expensive as they were during the Internet bubble. Image: Tomasz Hońdo
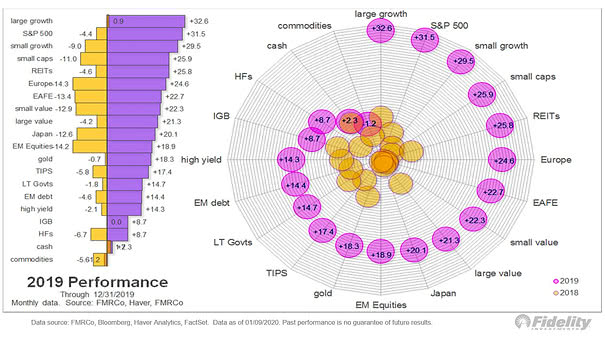
2019 Market Performance Compared to 2018 Large growth, S&P 500, small growth, small caps and REITs perform best in 2019. Image: Fidelity Investments
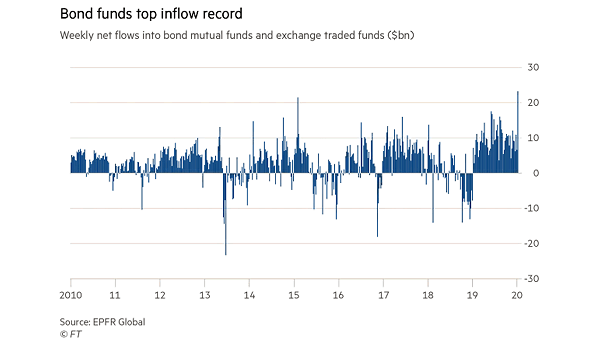
Weekly Net Flows into Bond Mutual Funds and Exchange Traded Funds Bond funds posted record inflows as the Iranian crisis intensified. Image: Financial Times
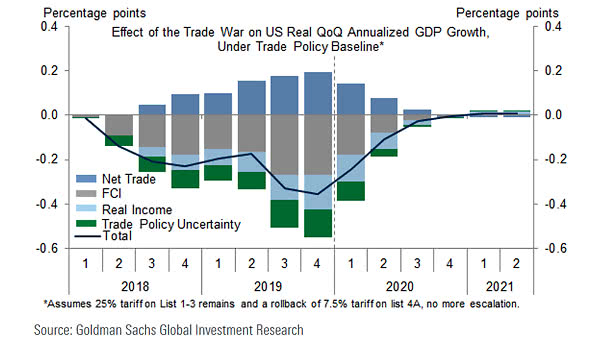
Effect of the Trade War on U.S. Real GDP Growth Assuming no further escalation, the trade war drag on real GDP growth is expected to gradually fade over the year. Image: Goldman Sachs Global Investment Research