Dow Jones Price Since 1980
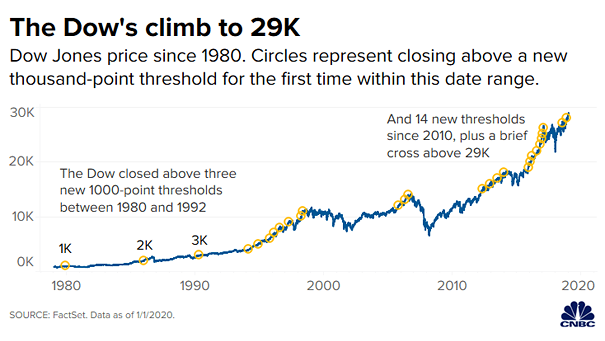
Dow Jones Price Since 1980 Historical chart of the Dow Jones from 1K to 29K. Image: CNBC
Dow Jones Price Since 1980 Historical chart of the Dow Jones from 1K to 29K. Image: CNBC
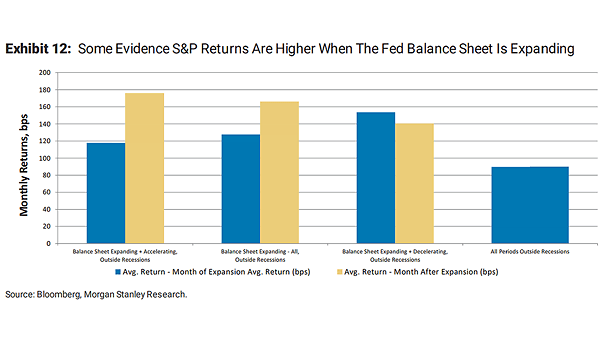
S&P 500 Returns and Fed Balance Sheet This chart suggests the positive relationship between the Fed’s balance sheet expansion and S&P 500 returns. Image: Morgan Stanley Research
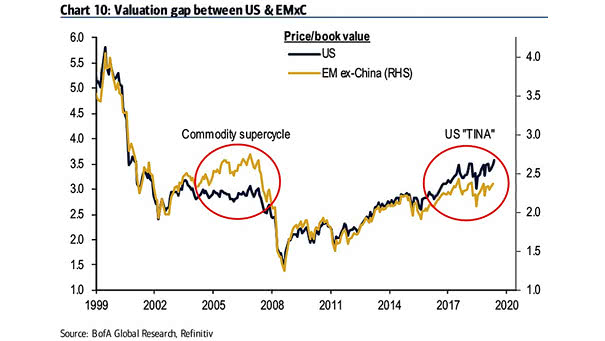
Valuation Gap Between U.S. and Emerging Markets ex-China According to BofA, emerging markets ex-China benefit from favorable demographics, modernization potential, and attractive valuations for the long term. Image: BofA Global Research
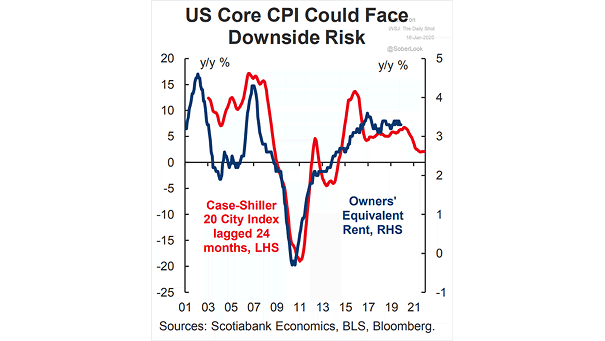
U.S. Core Inflation vs. Home Prices (Leading Indicator) Home prices suggest that core CPI seems likely to fall further. Image: Scotiabank Economics
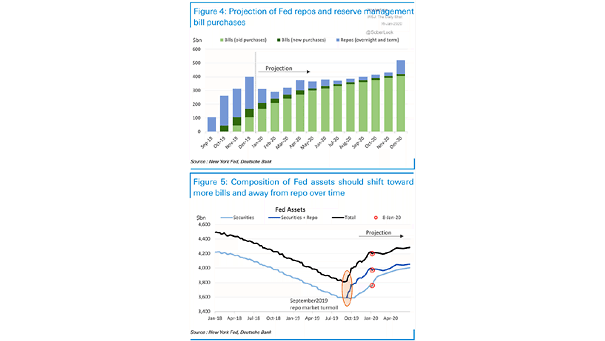
Fed’s Balance Sheet Composition Chart suggesting that the Fed should buy more Treasury bills and shift away from repo operations over time. Image: Deutsche Bank

Gold vs. Fed Funds Futures Chart showing the current divergence between gold and the implied Fed funds rate. Image: Longview Economics
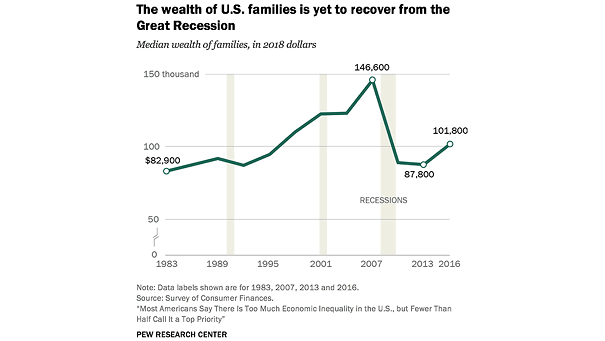
Inequality – Median Wealth of U.S. Families The median value of assets owned by an American family is no higher than it was 20 years ago. Image: PEW Research Center
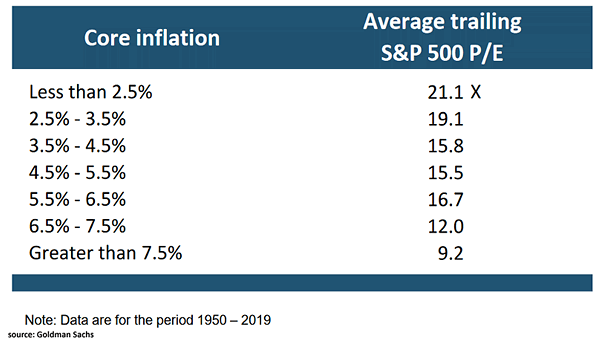
Core Inflation and Average Trailing S&P 500 P/E Ratio In periods of low inflation, the P/E ratio is higher. Conversely, high inflation tends to depress the P/E ratio. Image: Goldman Sachs Global Investment Research
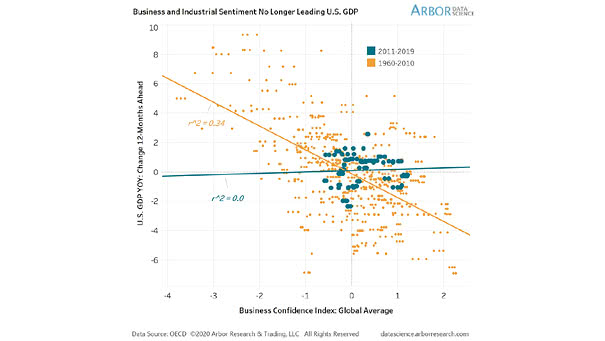
Business and Industrial Sentiment vs. U.S. GDP Chart suggesting that business and industrial surveys have not explained U.S. economic growth over the past decade (R² = 0). Image: Arbor Research & Trading LLC
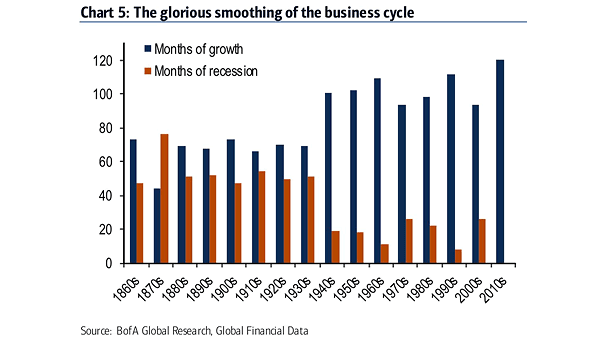
U.S. Business Cycle – Months of Growth vs. Months of Recession This chart puts into perspective the U.S. business cycle and the length of recessions. Image: BofA Global Research
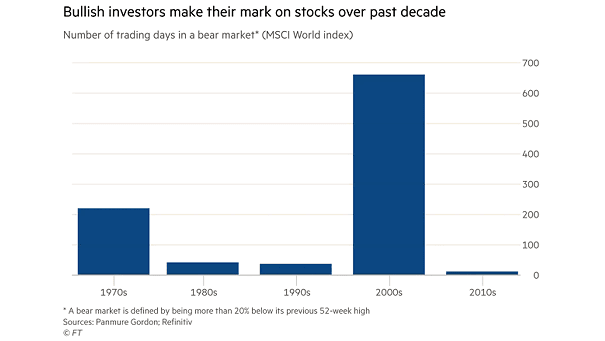
Number of Trading Days in a Bear Market (MSCI World Index) Stimulus and extremely low interest rates have moved global equities higher over past decade. Image: Financial Times