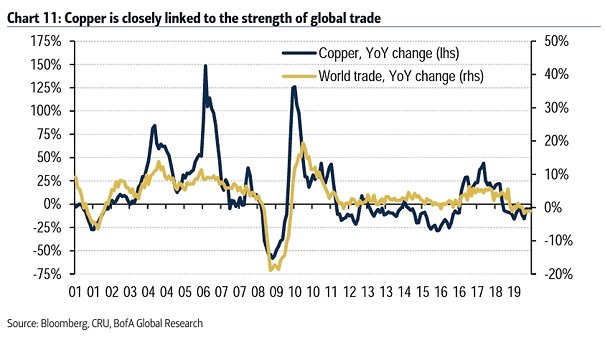
World Trade and Copper
World Trade and Copper Chart suggesting that any improvement in world trade should benefit copper. Image: BofA Global Research
World Trade and Copper Chart suggesting that any improvement in world trade should benefit copper. Image: BofA Global Research
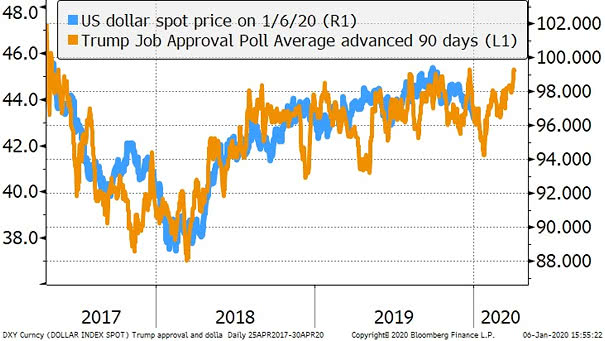
U.S. Dollar and Trump Job Approval Poll Average (Leading Indicator) This chart suggests that the U.S. dollar could rise, if it continues to track Trump’s approval rating. Image: Jeffrey Kleintop
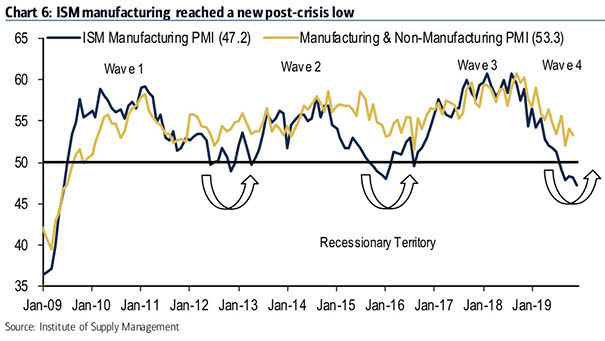
U.S. ISM Manufacturing and Non-Manufacturing PMI Chart suggesting that ISM indices imply a slowdown rather than a recession. Image: BofA Global Research
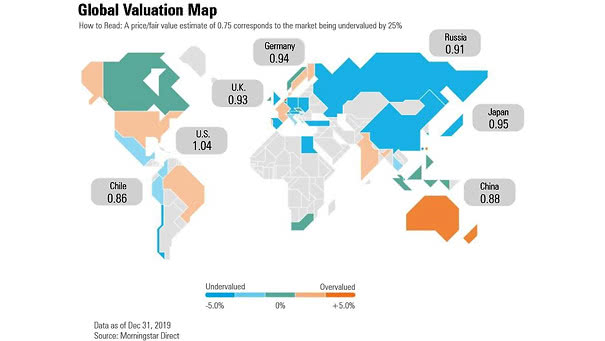
Global Valuation Map This chart shows global valuation estimates across various countries, and suggests that the U.S. stock market is overvalued by +4%. Image: Morningstar Research
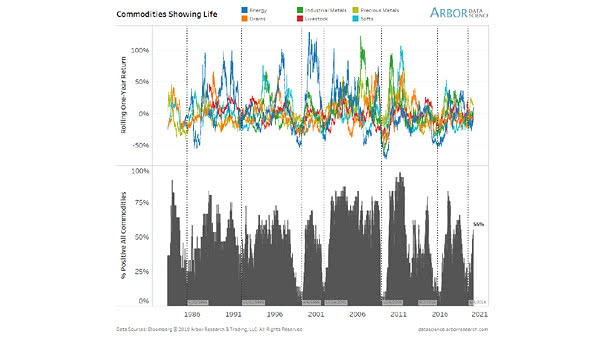
% Positive All Commodities Commodities are back in a big way. The % of commodities producing positive year-over-year returns has jumped to 55%. Image: Arbor Research & Trading LLC
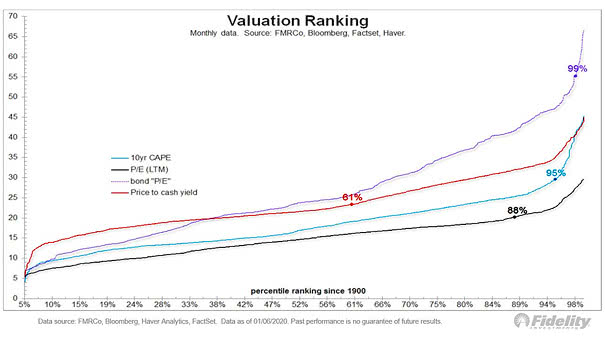
S&P 500 Valuation Ranking On a P/E basis, the S&P 500 Index is now valued at the 88th percentile vs. 28th percentile a year ago. Image: Fidelity Investments
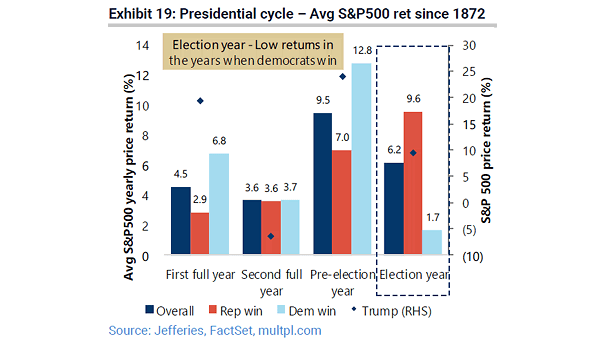
U.S. Election – Presidential Cycle and Average S&P 500 Return since 1872 Since 1872, the S&P500 index has averaged 6.2% during an election year, and 9.6% on average if a Republican wins. Image: Jefferies
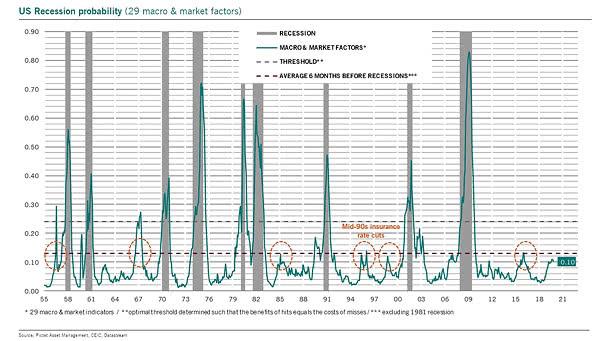
U.S. Recession Probability Based on 29 Macro and Market Factors The U.S. recession probability is still below its average 6 months prior to the past 9 recessions. Image: Pictet Asset Management
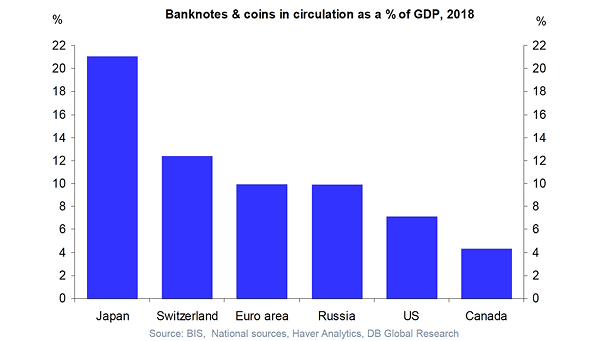
Cash – Banknotes and Coins in Circulation as a Percentage of GDP This chart suggests that negative interest rates can increase the demand for cash. Image: Deutsche Bank Global Research
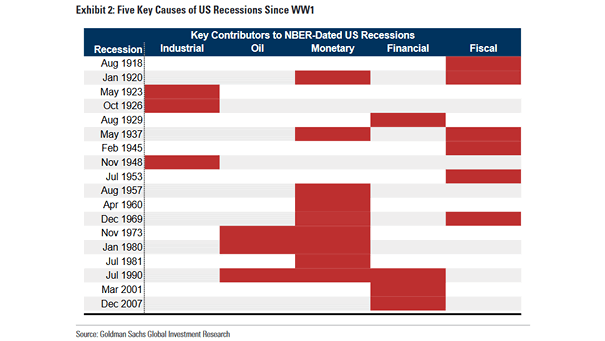
Five Key Causes of U.S. Recessions Since WW1 This great table highlights the key contributors to the 18 official U.S. recessions over the last 100 years. Image: Goldman Sachs Global Investment Research
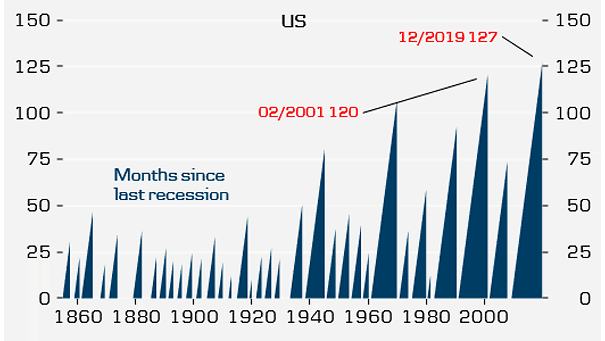
Months Since Last U.S. Recession and Business Cycles The U.S. economy has experienced record growth for 127 consecutive months. This is the longest period on record. Image: Danske Bank Research, Mikael Olai Milhøj