S&P 500 Total Return Decomposition by Sector
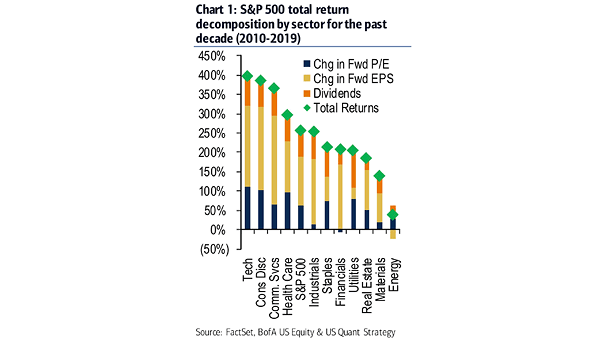
S&P 500 Total Return Decomposition by Sector Financials is the only sector that has experienced multiple contraction for the past decade. Image: BofA US Equity & Quant Strategy
S&P 500 Total Return Decomposition by Sector Financials is the only sector that has experienced multiple contraction for the past decade. Image: BofA US Equity & Quant Strategy
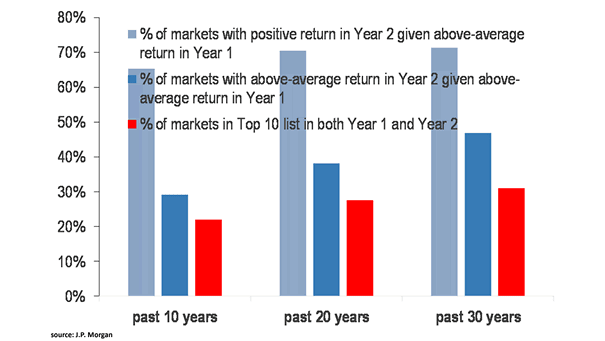
Percentage of Markets with Positive Return in Year Two Historically, markets have generally finished higher in year two given above-average return in year one. Image: J.P. Morgan
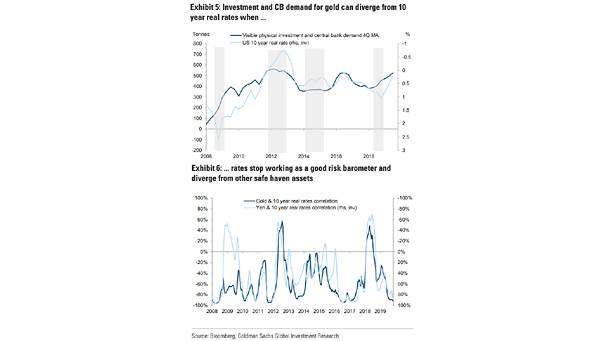
Gold and U.S. 10 Year Real Rate During the next recession, when fear skyrockets, gold could outperform rates. Image: Goldman Sachs Global Investment Research
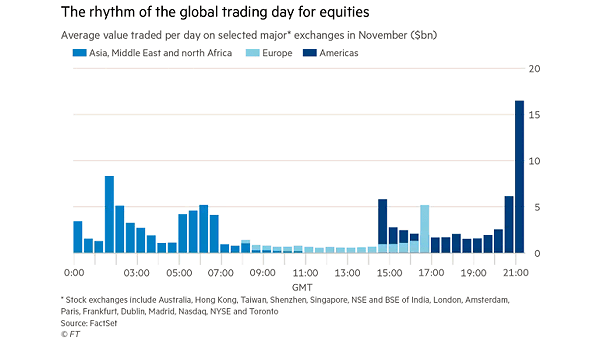
The Rhythm of the Global Trading Day of Equities The desire to shorten market hours is gaining traction in Europe. Image: Financial Times
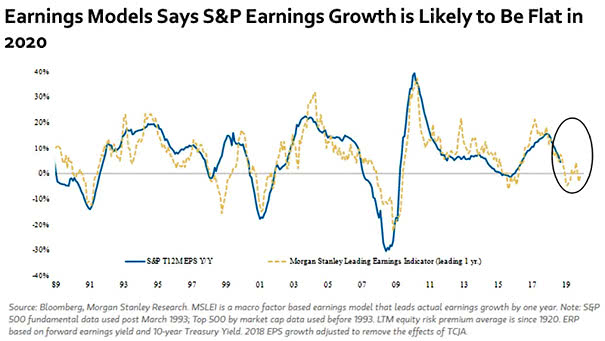
S&P 500 Earnings Growth Forecast Morgan Stanley is cautious and expects S&P 500 earnings growth to be flat this year. Image: Morgan Stanley Research

Rate Decisions by Global Central Banks This chart puts into perspective rate decisions by central banks around the world. Global central banks haven’t cut this much since the Great Financial Crisis.
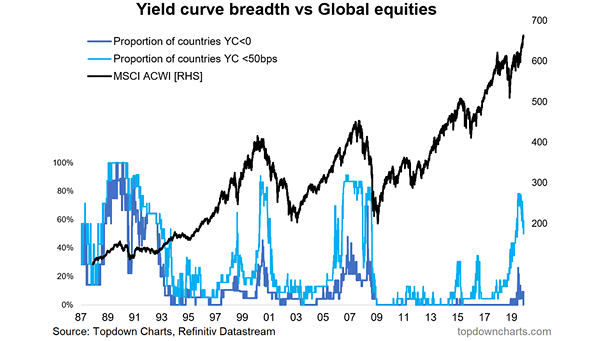
Yield Curve vs. Global Equities Global yield curves suggest optimism for risk assets in 2020. Image: Topdown Charts
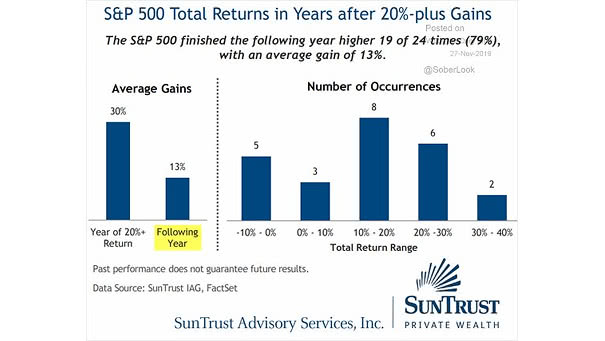
S&P 500 Total Returns in Years After 20%-plus Gains Historically, the S&P 500 has finished higher 79% of the time with an average gain of 13%. Image: Truist
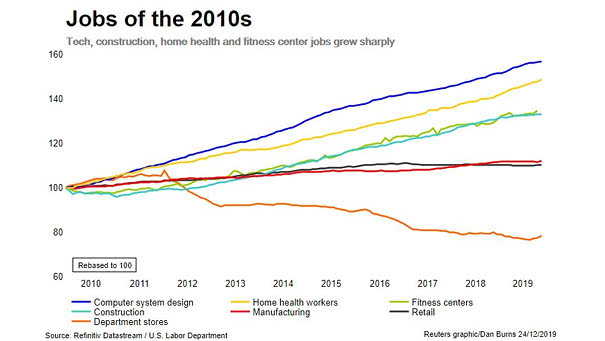
U.S. Jobs of the 2010s Jobs in tech, construction, home health and fitness center were among the fastest growing of the decade. Image: Reuters
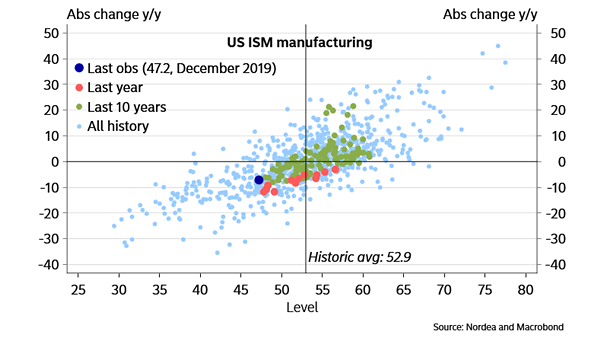
U.S. ISM Manufacturing Index (All History) History clearly shows that the current U.S. ISM Manufacturing Index is low. Image: Nordea and Macrobond
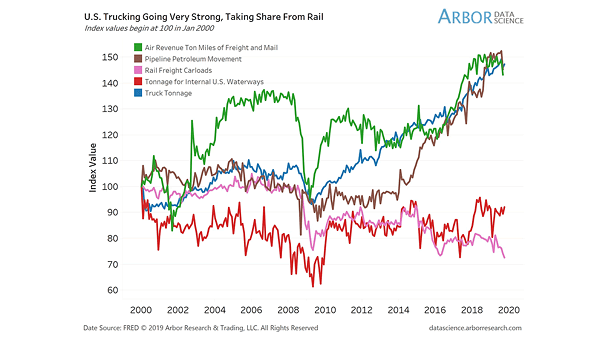
Truck Tonnage vs. Air and Rail Freight Trucks represent 70% of U.S. freight and serve as a barometer of the U.S. economy. This chart suggests that shipping has changed since the Great Financial Crisis, but is not deteriorating. Image: Arbor Research & Trading LLC