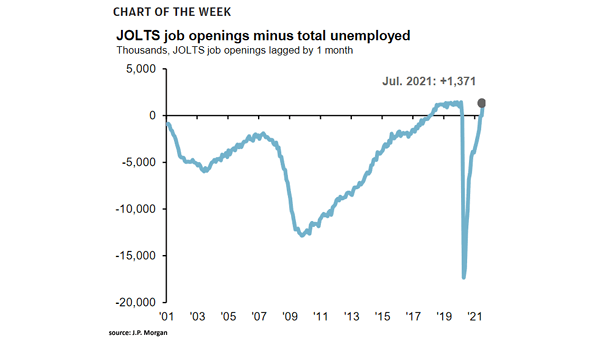
U.S. Labor Market – Job Openings per Unemployed Worker
U.S. Labor Market – Job Openings per Unemployed Worker The ratio of U.S. job openings to unemployed workers below 1 indicates labor market weakness, with policy uncertainty and slowing demand increasing the likelihood of a September Fed rate cut. Image: J.P. Morgan Asset Management