S&P 500 Volatility by Decade
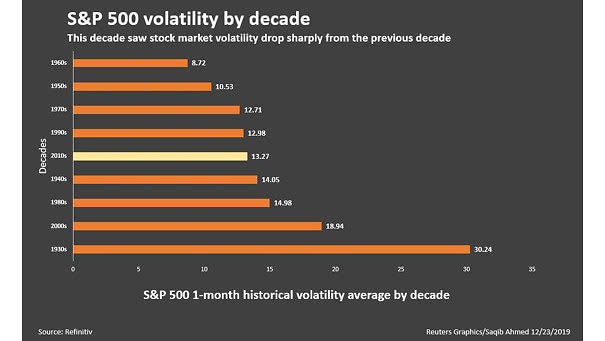
S&P 500 Volatility by Decade Volatility ended this decade at a lower level than the previous decade. Image: Reuters
S&P 500 Volatility by Decade Volatility ended this decade at a lower level than the previous decade. Image: Reuters
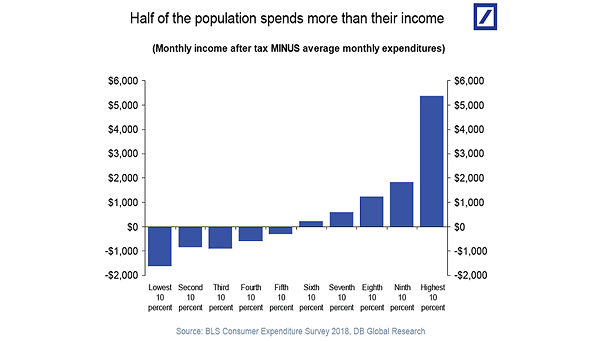
Inequality – Monthly Income After Tax Minus Average Monthly Expenditures Greatest economy ever? Despite increasing wage growth and a low unemployment rate, half of the U.S. population spends more than their income. Image: Deutsche Bank Global Research
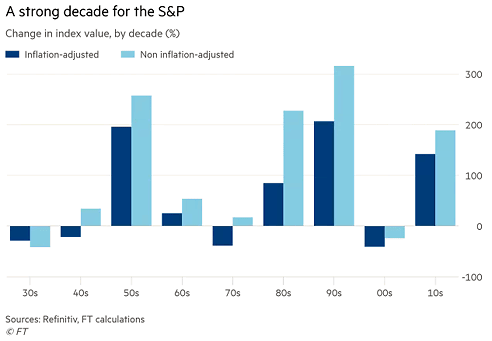
S&P 500 Returns by Decade The S&P 500 closes the decade with nearly 190% gain. Image: Financial Times
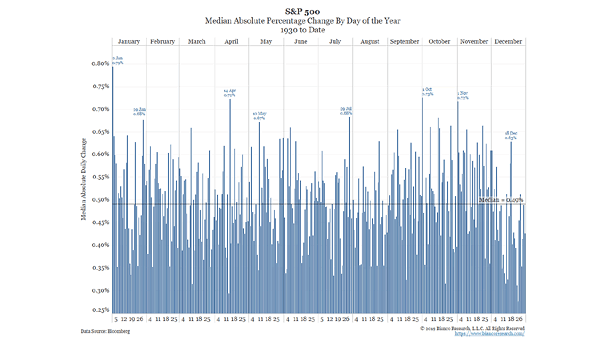
S&P 500 Median Absolute Percentage Change by Day of the Year Chart showing that January 2 is the most volatile day of the year since 1930, with a median absolute change of 0.79%. Image: Bianco Research
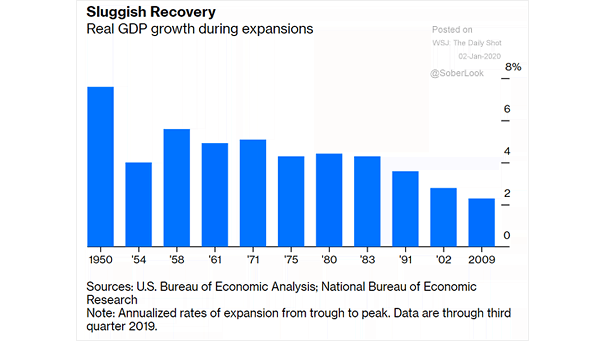
U.S. Real GDP Growth During Expansions The current business cycle is the longest, but it’s far from being the best. Image: Bloomberg

U.S. Unemployment Rate Forecast Goldman Sachs forecasts new lows in the U.S. unemployment rate in 2020. Image: Goldman Sachs Global Investment Research
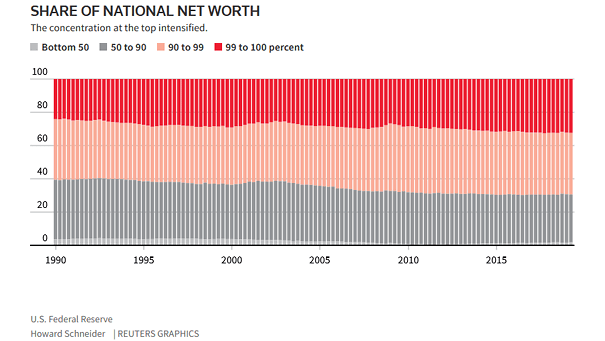
Inequality – Share of National Net Worth Net worth inequality in the United States worsens. Images: Reuters
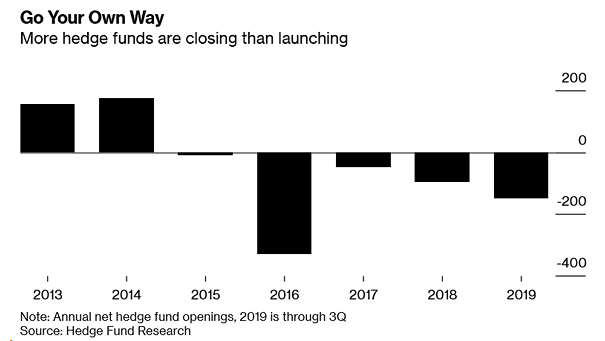
Annual Net Hedge Fund Openings Hedge funds are on track to record more closures than launches for the fifth consecutive year, due to mediocre returns and high fees. Image: Bloomberg
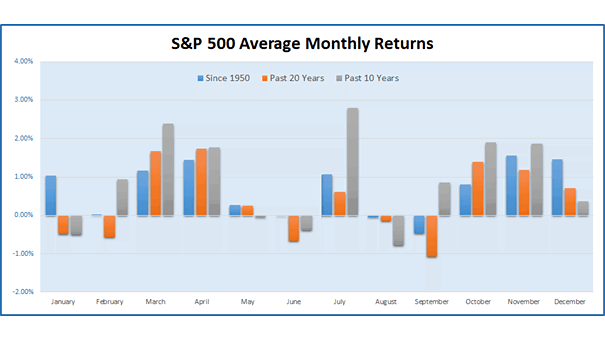
S&P 500 Average Monthly Returns Since 1950, the S&P 500 has been positive on average in January, but not over the past 10 & 20 years. Image: Ryan Detrick, LPL Financial LLC
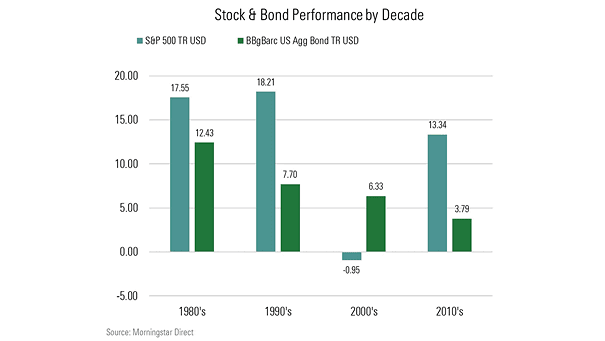
Historical Returns of Stocks and Bonds by Decade The next decade could see anemic returns, due to low growth, low yields and low inflation expectations. Image: Morningstar
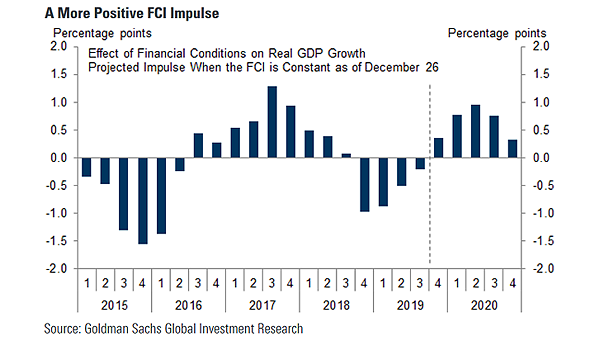
Effect of Financial Conditions on U.S. Real GDP Growth Chart suggesting an improvement of U.S. real GDP growth in 2020, as the impulse from financial conditions turns positive. Image: Goldman Sachs Global Investment Research