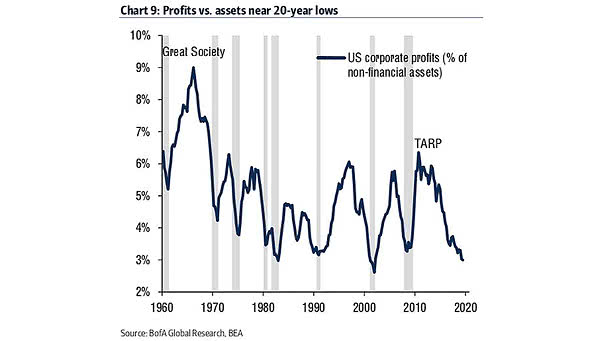
Rotation vs. U.S. GDP Growth Forecasts

Rotation vs. U.S. GDP Growth Forecasts Chart suggesting that the rotation out of bonds into equities, out of growth into cyclicals, out of large caps into small caps, and out of gold into copper, is expected to continue in 2020. Image: Fidelity Investments

Number of Countries in Each Cycle Stage

Number of Countries in Each Cycle Stage Chart suggesting that the global synchronised slowdown is over. According to the OECD leading indicators, the number of countries in recovery is rising. Image: TS Lombard

U.S. Stock Market Breadth

U.S. Stock Market Breadth The US stock market breadth is improving and continues to drive stocks higher. Image: Fidelity Investments

MSCI Europe Relative to S&P 500

MSCI Europe Relative to S&P 500 The relative range between the MSCI Europe Index and the S&P 500 has been broken since the European financial crisis. Since 2011, European equities have underperformed the U.S. at a -5.5% annual rate. Image: Deutsche Bank Global Research