MSCI Europe Relative to S&P 500

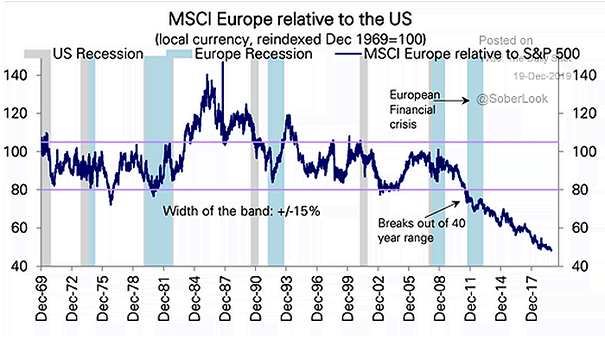
MSCI Europe Relative to S&P 500 The relative range between the MSCI Europe Index and the S&P 500 has been broken since the European financial crisis. Since 2011, European equities have underperformed the U.S. at a -5.5% annual rate. Image: Deutsche Bank Global Research

BofA Fund Managers Sentiment vs. MSCI ACWI TR

BofA Fund Managers Sentiment vs. MSCI ACWI TR Fund managers are euphoric about the future state of the global economy, but the chart suggests that the euphoria has not yet reached the warning zone. Image: Tomasz Hońdo

U.S. Buybacks and Buyback Yield

U.S. Buybacks and Buyback Yield Buybacks are expected to slow to $625bn in 2020, while providing robust yields. Image: Wells Fargo Investment Institute