S&P 500 and Moving Average
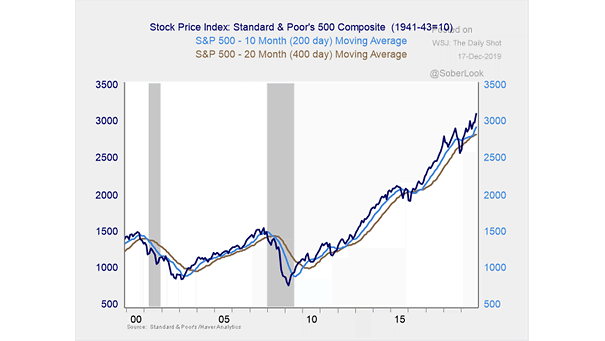
S&P 500 and Moving Average When the 200-day moving average is back above the 400-day moving average, it tends to be bullish for the S&P 500. Image: Commonwealth Financial
S&P 500 and Moving Average When the 200-day moving average is back above the 400-day moving average, it tends to be bullish for the S&P 500. Image: Commonwealth Financial
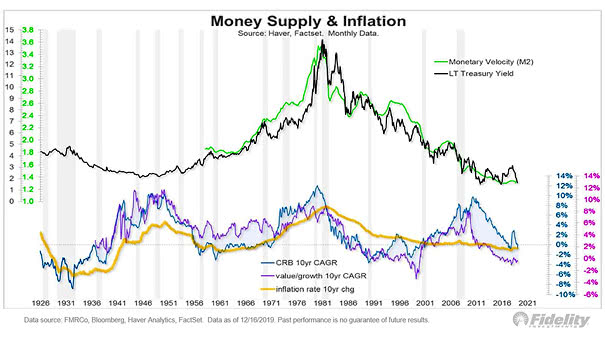
Money Supply and Inflation Aging is inflationary when caused by a decline in birth rate, and deflationary when caused by an increase in longevity. If the money supply grows faster than real output, then it causes inflation. And if there is a structural bottom for commodities and inflation, value could outperform growth. Image: Fidelity Investments
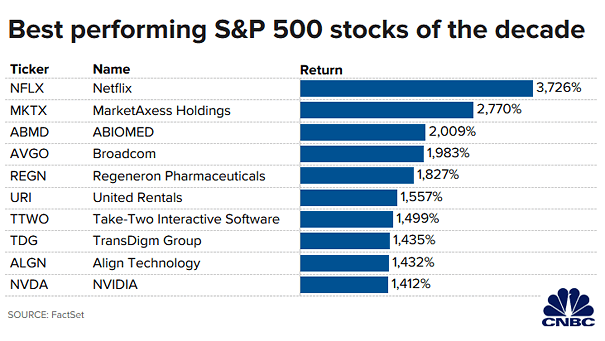
Best Performing S&P 500 Stocks of the Decade Netflix is by far the best performing U.S. stock of the decade. Image: CNBC
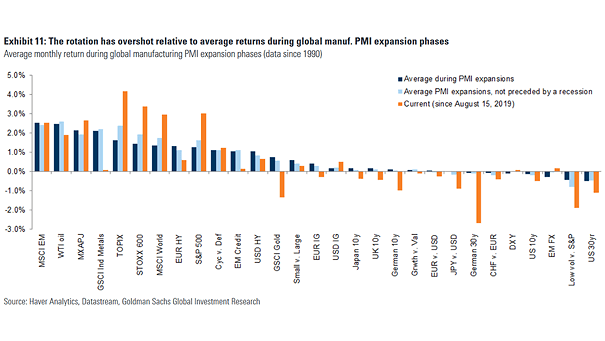
Average Monthly Return During Global Manufacturing PMI Expansion Phases Since August 15 2019, the rotation performance has been higher than average during global manufacturing PMI expansion phases. Image: Goldman Sachs Global Investment Research
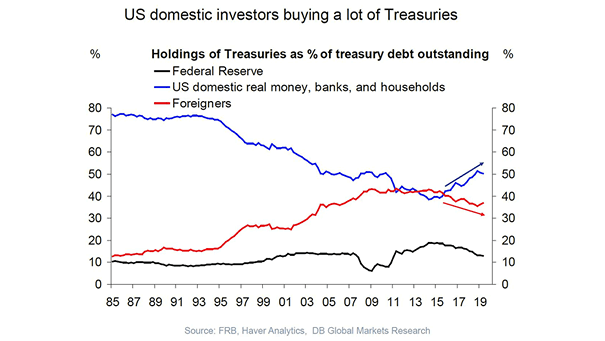
Holdings of U.S. Treasuries as Percent of Treasury Debt Outstanding U.S. domestic investors are buying a lot of U.S. Treasuries, while foreign demand is weakening. Image: Deutsche Bank Global Research
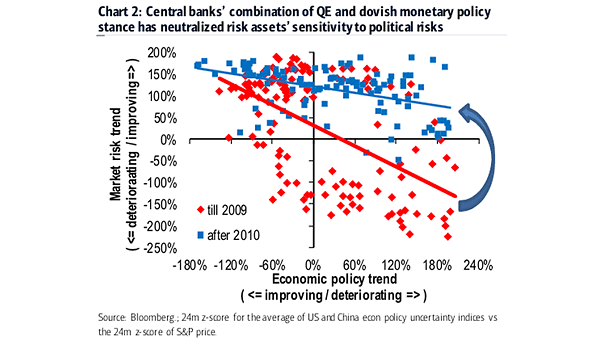
Central Banks – Market Risk Trend and Economic Policy Trend Chart suggesting that risk assets’ sensitivity to political risks has been neutralized by central banks’ QE and dovish monetary policy stance. Image: Image: BofA Global Research
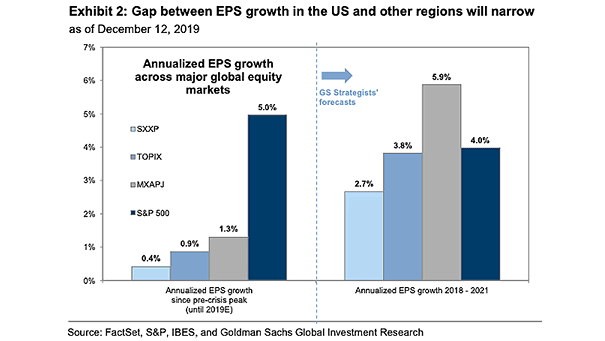
Annualized EPS Growth Across Major Global Equity Markets Goldman Sachs expects that EPS will modestly accelerate to 6% in the U.S. next year. Image: Goldman Sachs Global Investment Research
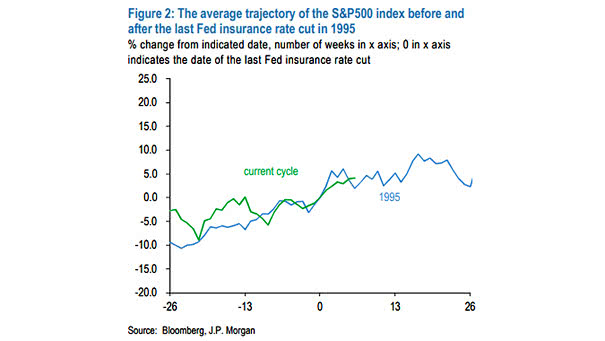
S&P 500 Index and Fed Insurance Rate Cut Chart suggesting around 5% upside for the S&P 500 Index through mid-2020. Image: J.P. Morgan
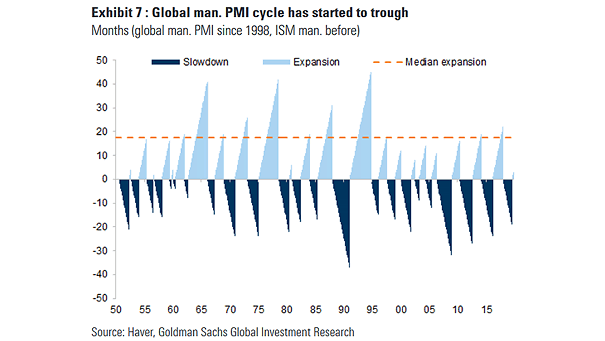
Global Manufacturing PMI Cycle Chart suggesting that the worst is over for global manufacturing PMI. Image: Goldman Sachs Global Investment Research
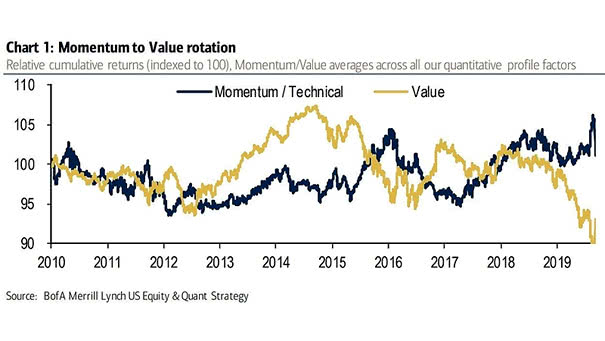
Momentum to Value Rotation The rotation into value suggests a rebound in global economic growth, not a recession. Image: BofA Merrill Lynch US Equity & US Quant Strategy
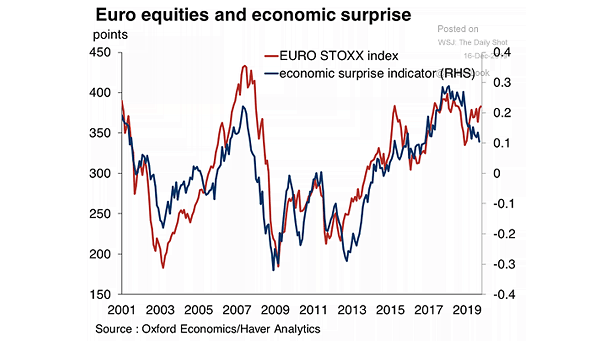
Correlation – Euro Equities and Economic Surprise The correlation between euro equities and economic surprise has diverged recently. Image: Oxford Economics