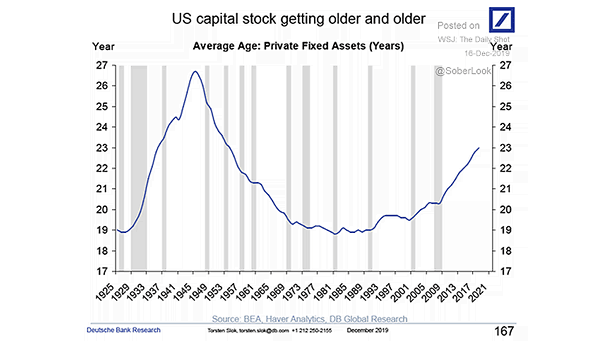
Equity Yields vs. Bond Yields vs. Cash Yields
Equity Yields vs. Bond Yields vs. Cash Yields Chart showing the large gap in yields between equities, bonds and cash. Image: J.P. Morgan
Cumulative Interest Rate Cuts in OECD Countries Central banks in OECD countries haven’t cut this much since the Great Financial Crisis. Image: Deutsche Bank Global Research
U.S. 10-Year Note Yield: Reaction to Recoveries From Global Slowdowns Past recoveries from global slowdowns suggest that the 10-year Treasury yield could increase. Image: Arbor Research & Trading LLC
U.S. Corporate CCC-Rated Bonds Diverge During Trade War As the chart suggests, CCC-rated bonds are not the canary in the coal mine. The divergence in option-adjusted spreads between CCCs and higher-rated issues reflects the impact of the US-China trade war. Image: Arbor Research & Trading LLC
Valuation – Forward P/E Ratio From the valuation peak of January 2018, most P/E ratios have seen drawdowns of 20%-30%, making this feel like a bear market. Image: Fidelity Investments
S&P 500 Price to Book Value vs. Future Returns The current S&P 500 price to book value suggests that equity market returns will be low over the next 10 years (R² = 0.86). Image: Tomasz Hońdo
S&P 500 Levels, Bank Projections Morgan Stanley is a bear, but Wall Street expects gains for the S&P 500 in 2020 Image: Financial Times
Yield Curve 10Y-2Y and U.S. ISM Manufacturing Index Chart suggesting that the U.S. 2+10Y bond yield YoY (inverted) tends to lead the U.S. ISM Manufacturing Index (YoY) by 18 months. U.S. PMI could bounce back in 2020. Image: Nordea and Macrobond
JPMorgan Global Manufacturing PMI The JPMorgan Global Manufacturing PMI rises to a seven-month high of 50.3, after having been in contraction territory. NBF Economics and Strategy
The 2020 S&P 500 Upside Level According to BofAML, history suggests a bullish setup for the S&P 500 in 2020, and a S&P 500 target of 3300-3600 in late 2020. Image: BofA Merrill Lynch Global Research
Venture Capital Assets Under Management The center of venture capital gravity is shifting. Asia could overtake the United States. Image: Quill Intelligence, LLC