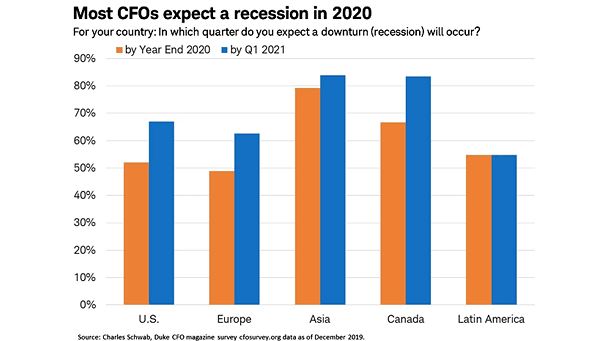
Most CFOs Expect A Recession Next Year
Most CFOs Expect A Recession Next Year CFO Survey: most CFOs predict a recession in 2020. Image: Charles Schwab, Duke CFO Magazine
Most CFOs Expect A Recession Next Year CFO Survey: most CFOs predict a recession in 2020. Image: Charles Schwab, Duke CFO Magazine
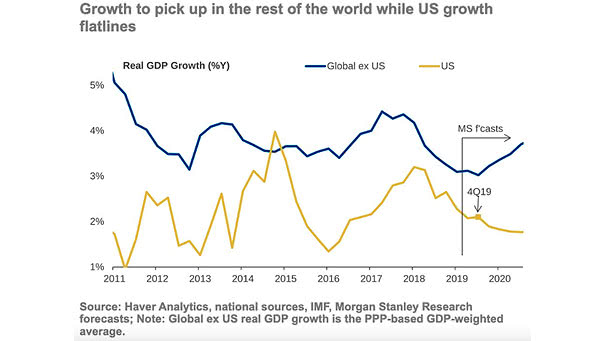
U.S. and Global Real GDP Growth Chart suggesting a rebound in global growth outside the United States. Image: Morgan Stanley Research
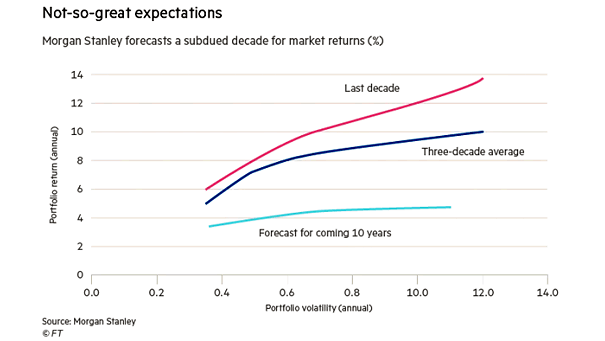
Morgan Stanley Forecasts a Subdued Decade for Market Returns Morgan Stanley forecasts anemic returns over the next 10 years, due to low yields, low growth and low inflation expectations. Image: Financial Times
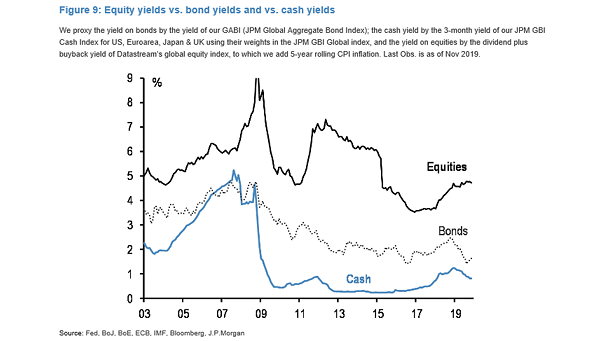
Equity Yields vs. Bond Yields vs. Cash Yields Chart showing the large gap in yields between equities, bonds and cash. Image: J.P. Morgan
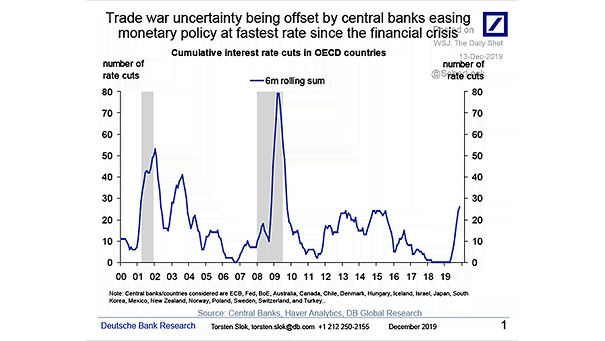
Cumulative Interest Rate Cuts in OECD Countries Central banks in OECD countries haven’t cut this much since the Great Financial Crisis. Image: Deutsche Bank Global Research
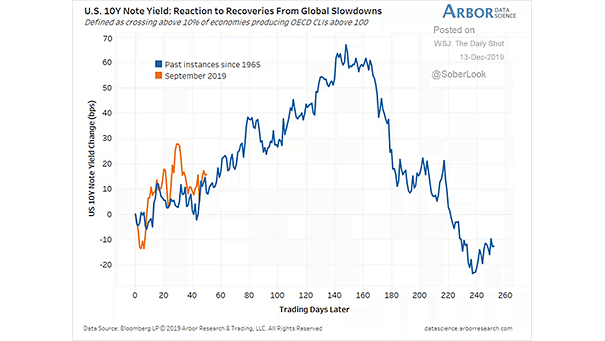
U.S. 10-Year Note Yield: Reaction to Recoveries From Global Slowdowns Past recoveries from global slowdowns suggest that the 10-year Treasury yield could increase. Image: Arbor Research & Trading LLC
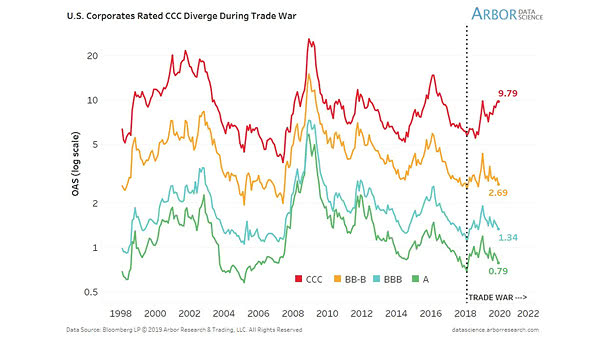
U.S. Corporate CCC-Rated Bonds Diverge During Trade War As the chart suggests, CCC-rated bonds are not the canary in the coal mine. The divergence in option-adjusted spreads between CCCs and higher-rated issues reflects the impact of the US-China trade war. Image: Arbor Research & Trading LLC
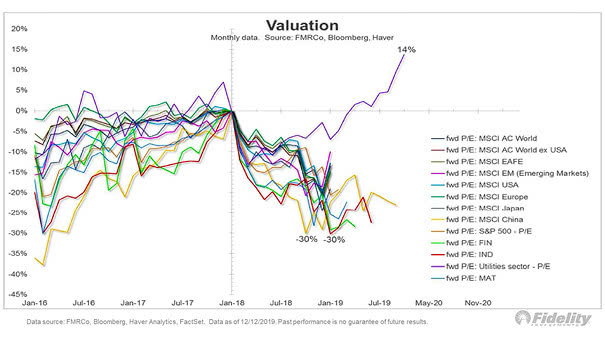
Valuation – Forward P/E Ratio From the valuation peak of January 2018, most P/E ratios have seen drawdowns of 20%-30%, making this feel like a bear market. Image: Fidelity Investments
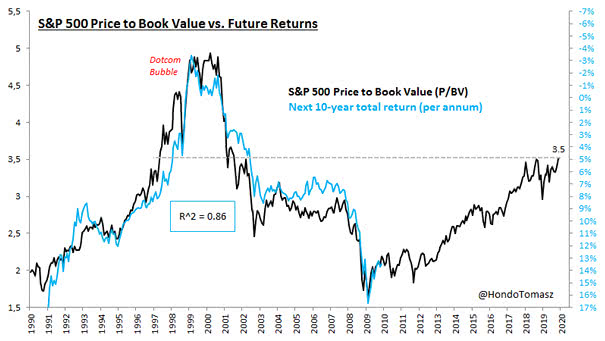
S&P 500 Price to Book Value vs. Future Returns The current S&P 500 price to book value suggests that equity market returns will be low over the next 10 years (R² = 0.86). Image: Tomasz Hońdo
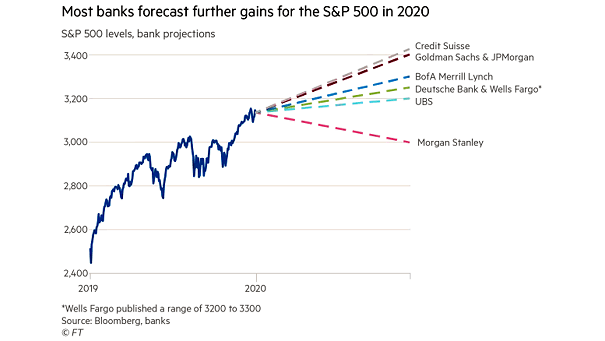
S&P 500 Levels, Bank Projections Morgan Stanley is a bear, but Wall Street expects gains for the S&P 500 in 2020 Image: Financial Times
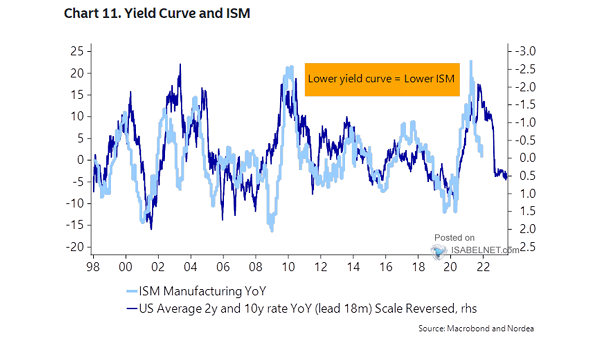
Yield Curve 10Y-2Y and U.S. ISM Manufacturing Index Chart suggesting that the U.S. 2+10Y bond yield YoY (inverted) tends to lead the U.S. ISM Manufacturing Index (YoY) by 18 months. U.S. PMI could bounce back in 2020. Image: Nordea and Macrobond