JPMorgan Global Manufacturing PMI
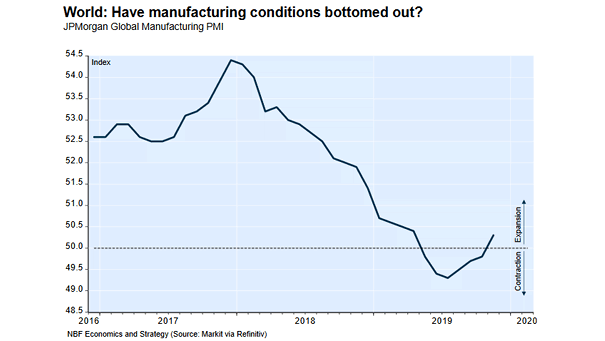
JPMorgan Global Manufacturing PMI The JPMorgan Global Manufacturing PMI rises to a seven-month high of 50.3, after having been in contraction territory. NBF Economics and Strategy
JPMorgan Global Manufacturing PMI The JPMorgan Global Manufacturing PMI rises to a seven-month high of 50.3, after having been in contraction territory. NBF Economics and Strategy
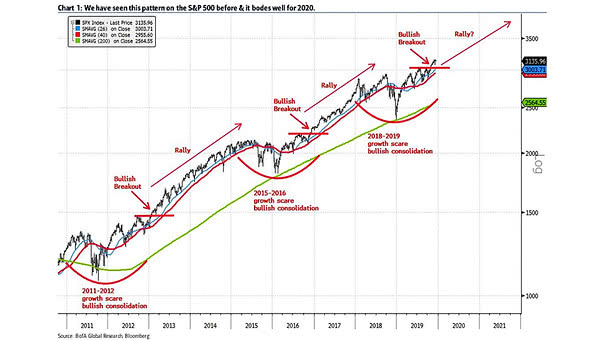
The 2020 S&P 500 Upside Level According to BofAML, history suggests a bullish setup for the S&P 500 in 2020, and a S&P 500 target of 3300-3600 in late 2020. Image: BofA Merrill Lynch Global Research
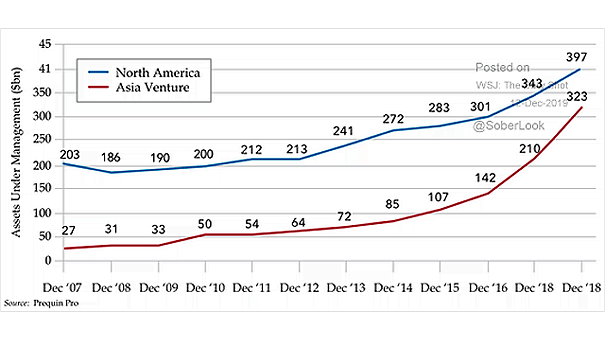
Venture Capital Assets Under Management The center of venture capital gravity is shifting. Asia could overtake the United States. Image: Quill Intelligence, LLC
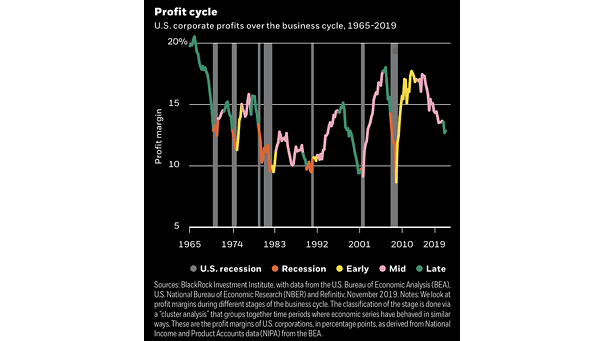
U.S. Corporate Profits over the Business Cycle U.S. corporate profits are at risk in the late stage of the expansion. mage: BlackRock Investment Institute
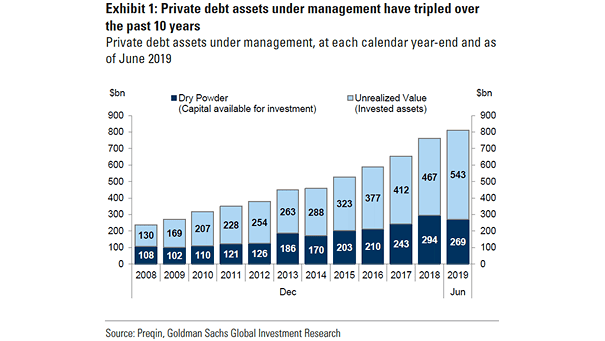
Private Debt Assets Under Management Private debt assets under management have tripled over the past decade to $812 billion. Investors are looking to increase yield in a world of low interest rates. Image: Goldman Sachs Global Investment Research
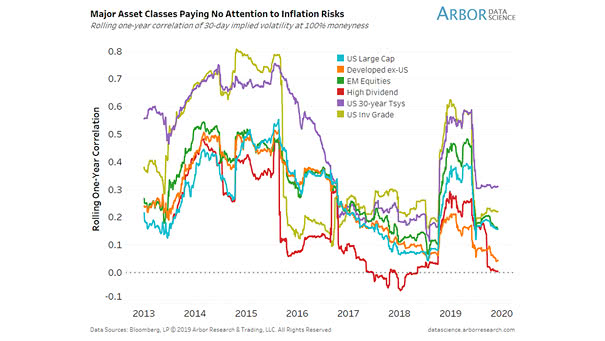
Asset Classes and Inflation Risks Chart suggesting that major asset classes do not take inflation risks into account. Image: Arbor Research & Trading LLC
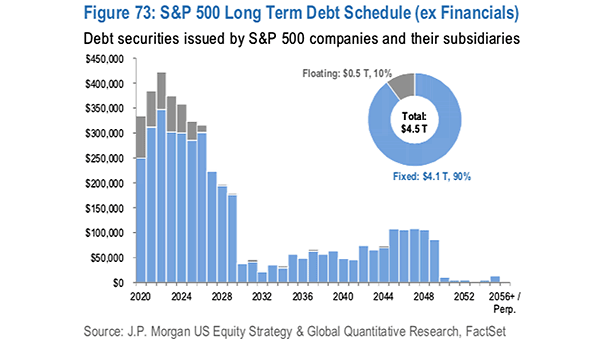
Debt Securities Issued by S&P 500 Companies Should investors be concerned about the corporate debt maturity wall? This chart shows the long term S&P 500 debt maturity schedule. Image: J.P. Morgan US Equity Strategy & Global Quantitative Research
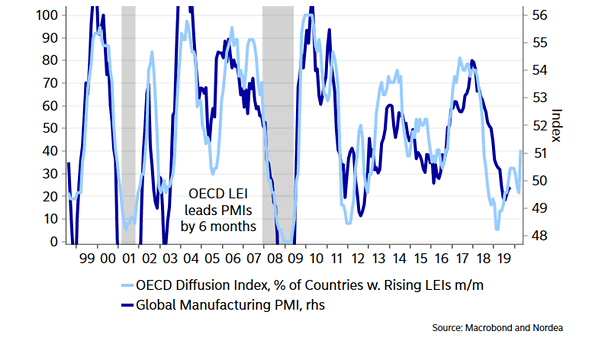
OECD LEI Tends to Lead Global Manufacturing PMI by 6 Months Chart suggesting a pick-up in the global manufacturing PMI. Image: Nordea and Macrobond
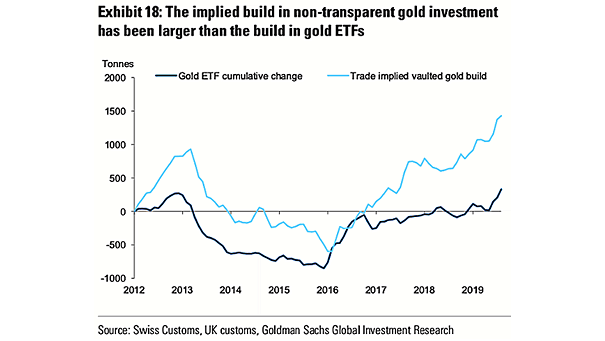
Gold ETF Cumulative Change and Trade Implied Vaulted Gold Build High-net-worth individuals around the world are trying to minimize economic and political risks by buying physical gold. Image: Goldman Sachs Global Investment Research

Probability of U.S. Recession – Real Economic Variables vs. Financial Variables Real economic variables do not suggest that a recession is imminent, while financial variables point to a higher risk of recession. Image: Nordea and Macrobond Click the Image to Enlarge
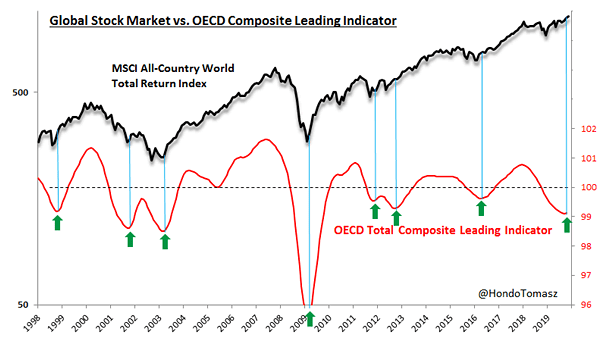
MSCI ACWI Total Return Index vs. OECD Composite Leading Indicator Chart suggesting that usually, when the OECD composite leading indicator is up (slightly), it is positive for equity markets. Image: Tomasz Hońdo