Simple U.S. Risk Parity Strategy
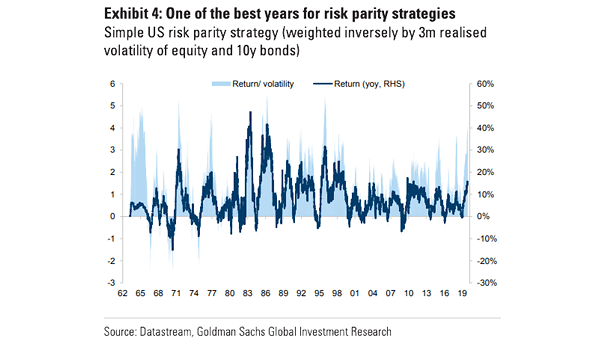
Simple U.S. Risk Parity Strategy Risk parity strategies performed very well this year. Image: Goldman Sachs Global Investment Research
Simple U.S. Risk Parity Strategy Risk parity strategies performed very well this year. Image: Goldman Sachs Global Investment Research
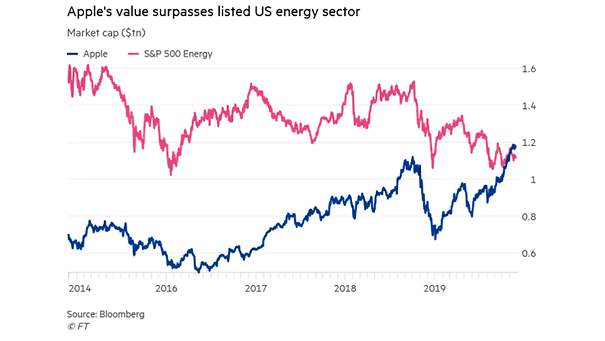
Valuation – Apple Market Capitalization and S&P 500 Energy Apple is now worth more than the U.S. energy sector. Image: Financial Times
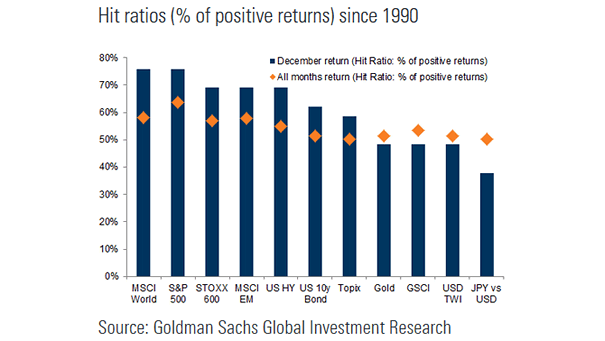
December Return vs. All Months Return Historically, the percentage of positive returns in December has been above average for stocks and bonds since 1990. Image: Goldman Sachs Global Investment Research

S&P 500 Performance 12-Months After ISM Manufacturing Index Below 50 for Four Months Since 1950, the S&P 500 has rallied 12-months later, 80% of the time, after the ISM Manufacturing Index was below 50 for four months, with an average return of 12%. Image: Arbor Research & Trading LLC
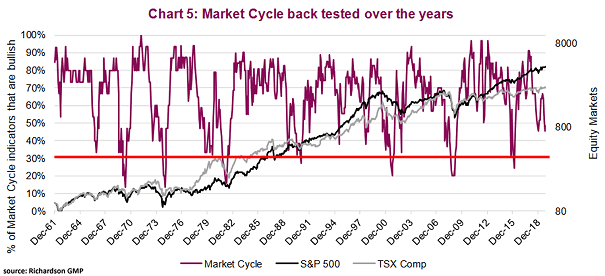
Market Cycle Back Tested over the Years Chart suggesting that the end of a bull market often occurs when the percentage signals that are bullish fall to 30% or below. Image: Richardson Wealth
Tracking Developed Markets Inflation More developed markets are missing their inflation goals. Image: Macrobond Financial
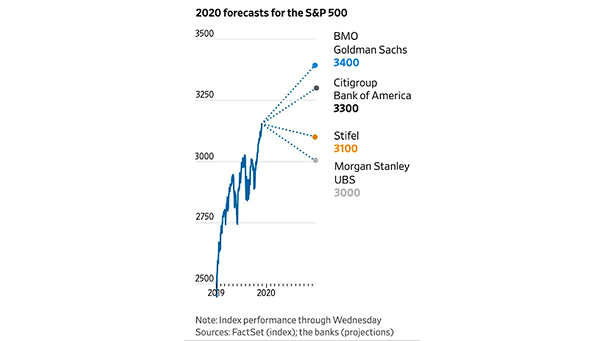
2020 Forecasts for the S&P 500 Analysts are forecasting losses or moderate gains for the S&P 500 in 2020. Image: The Wall Street Journal
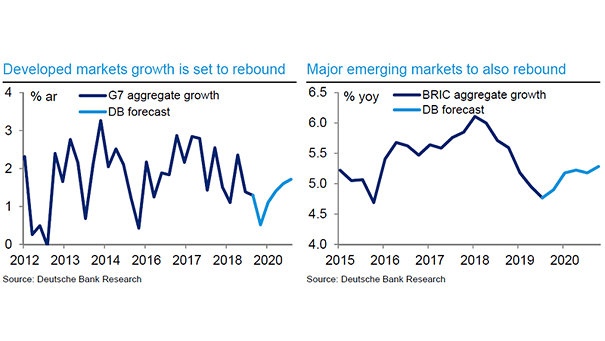
Developed and Major Emerging Markets Growth Forecast Chart suggesting that growth in developed and major emerging markets should improve in 2020. Image: Deutsche Bank Global Research
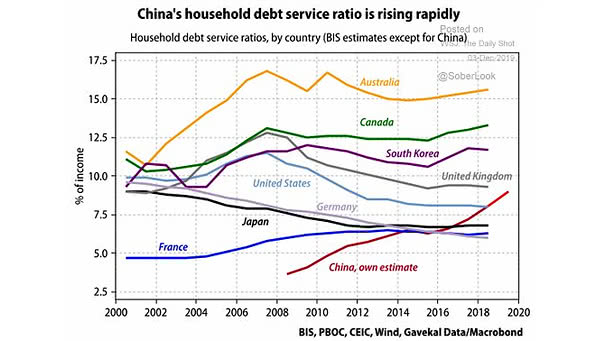
Household Debt Service Ratios by Country China’s household debt has grown rapidly in recent years. Image: Gavekal, Macrobond
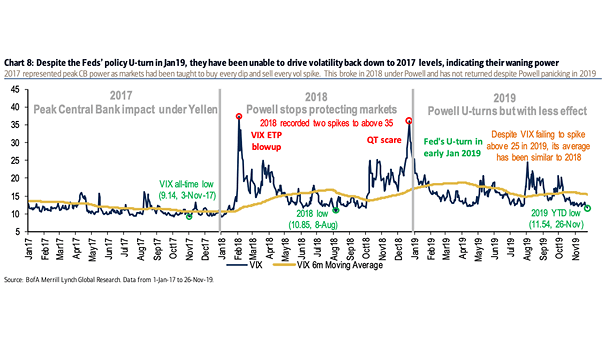
VIX and Fed Monetary Policy This year, the VIX average has been similar to 2018, despite Feds’ policy U-Turn in January. Image: BofA Merrill Lynch Global Research
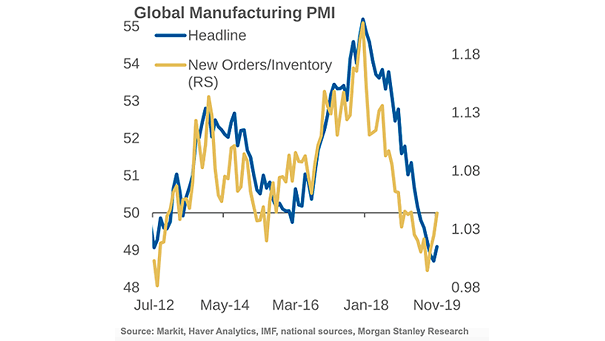
Global Manufacturing PMI and New Orders/Inventory Global Manufacturing PMI and new orders improved in November. Image: Morgan Stanley Research