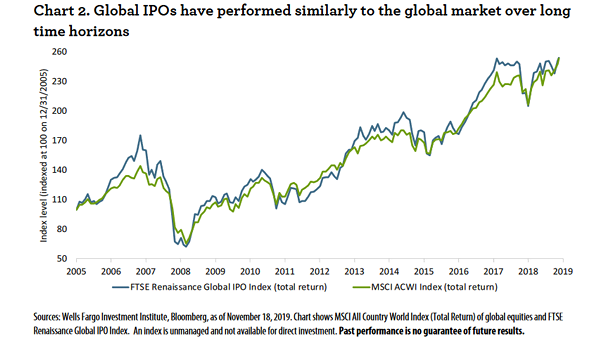
Valuation – Relative P/E High vs. Low Dividend Yield Stocks

Valuation – Relative P/E High vs. Low Dividend Yield Stocks This chart suggests that stocks that pay large dividends haven’t been so cheap since around 1980, relative to low dividend yield stocks. Image: Goldman Sachs Global Investment Research

House Prices Around Europe

House Prices Around Europe Chart showing house prices around Europe since the Great Financial Crisis. House prices in Norway and Sweden have been on a high rising trend. Image: Jeroen Blokland

World Equities and U.S. 10-Year Treasury Yield

World Equities and U.S. 10-Year Treasury Yield Chart suggesting that the round trip in U.S. Treasury yields explains the round trip in stock market valuation. Image: Financial Times

Long-Term U.S. Dollar Cycles

Long-Term U.S. Dollar Cycles This chart shows bear and bull cycles in the U.S. dollar. Will the U.S. dollar enter a bear market? Image: Alpine Macro

S&P 500 Forecast for 2020

S&P 500 Forecast for 2020 Goldman Sachs forecasts a price-target for the S&P 500 at 3400 by year-end 2020, and a downside scenario at 2600 depending on tariffs and the US election result. Image: Goldman Sachs

U.S. Dollar Debt in Emerging Markets

U.S. Dollar Debt in Emerging Markets This chart shows the wall of dollar debt in emerging markets over the next decade. Image: Financial Times

U.S. Corporate Leverage

U.S. Corporate Leverage U.S. corporate leverage is high and close to its previous peak on a net debt to EBITDA. Image: Goldman Sachs Global Investment Research