Share of Total U.S. Equity Trading
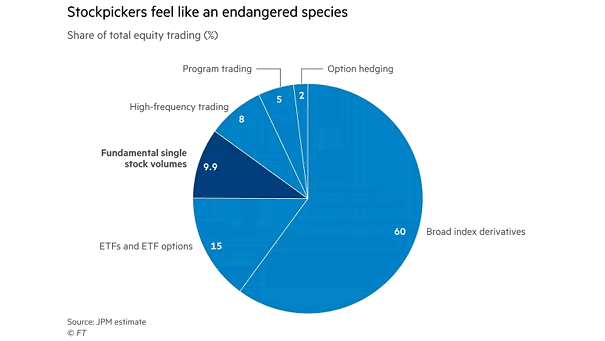
Share of Total U.S. Equity Trading Are stock pickers an endangered species? Only one-tenth of the US equity market’s trading volumes comes from fundamental equity investors. Image: Financial Times
Share of Total U.S. Equity Trading Are stock pickers an endangered species? Only one-tenth of the US equity market’s trading volumes comes from fundamental equity investors. Image: Financial Times

S&P 500 and Mini-Cycles Chart suggesting that market participants have started to take into account the start of a fourth mini-cycle. Image: Societe Generale Cross Asset Research
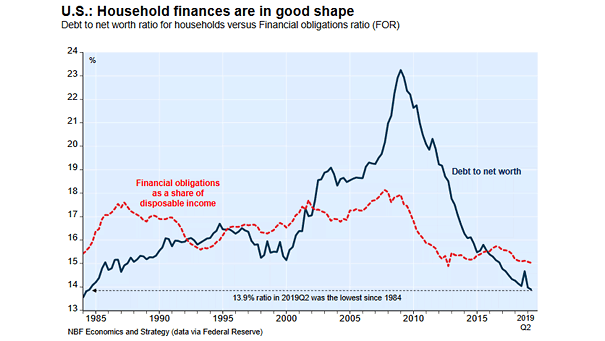
Debt to Net Worth Ratio for U.S. Households vs. Financial Obligations Ratio Chart suggesting that U.S. household finances are in good shape. This is good news for consumption spending, which accounts for about 70% of all U.S. economic activity. Image: NBF Economics and Strategy
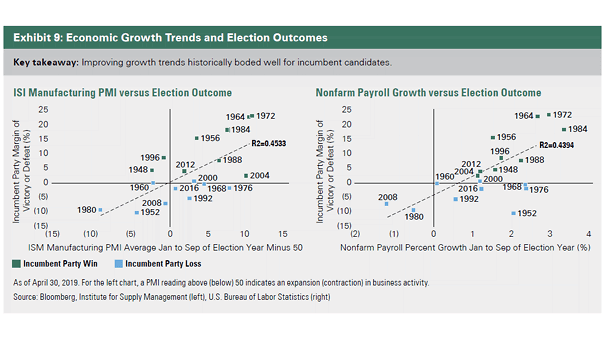
ISM Manufacturing PMI and Nonfarm Payroll Growth vs. U.S. Election Outcome Chart showing the relationship between growth trends into U.S. elections and the margin of victory or defeat for incumbent candidates. Historically, the probability of incumbents winning an election increases, as growth trends improve. Image: Bessemer Trust
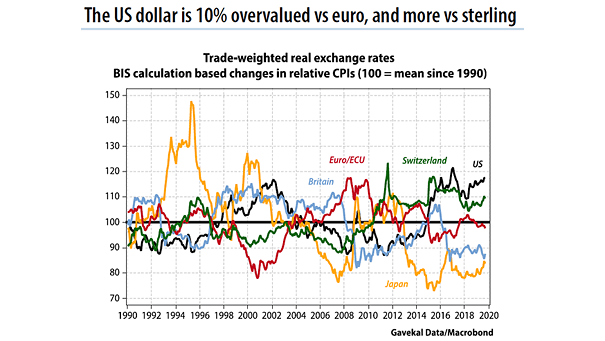
U.S. Dollar – Trade-Weighted Real Exchange Rates Chart suggesting that the U.S. dollar looks overvalued against euro and sterling. Image: Gavekal, Macrobond
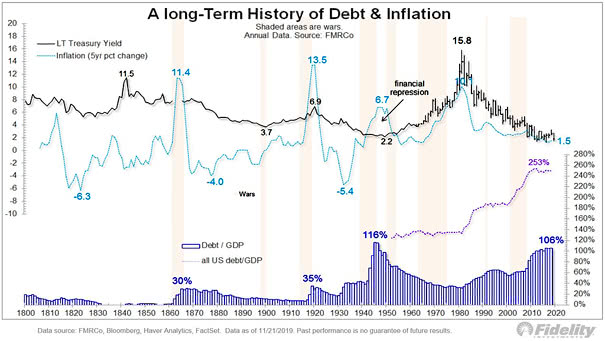
A Long-Term History of Debt and Inflation in the U.S. This chart puts debt and inflation in perspective. MMT could lead to high inflation and financial repression, as in the 1940s. Image: Fidelity Investments
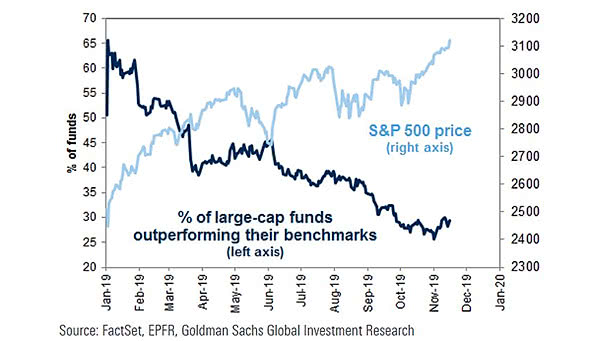
S&P 500 and Large-Cap Funds Outperformance Over Benchmarks Only 28% of large-cap funds are outperforming their benchmarks this year. Image: Goldman Sachs Global Investment Research
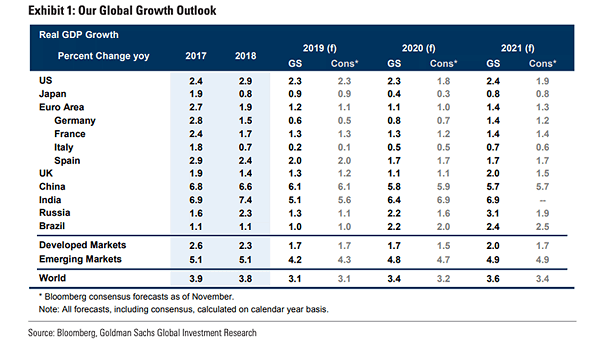
Global Growth Outlook (Global GDP) Goldman Sachs is optimistic and expects global growth to rise to 3.4% in 2020. Image: Goldman Sachs Global Investment Research
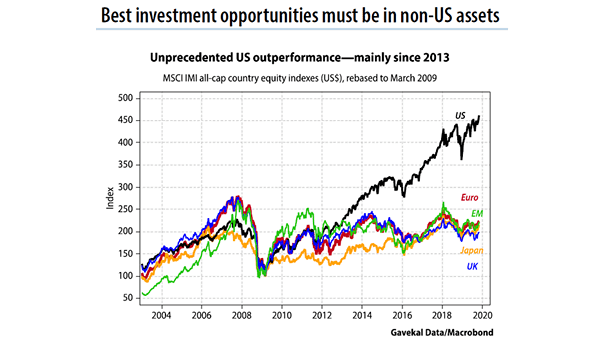
U.S. Equity Market Outperformance According to Gavekal, U.S. outperformance is mainly cyclical, not structural, and best investment opportunities could be in non-US assets. Image: Gavekal, Macrobond
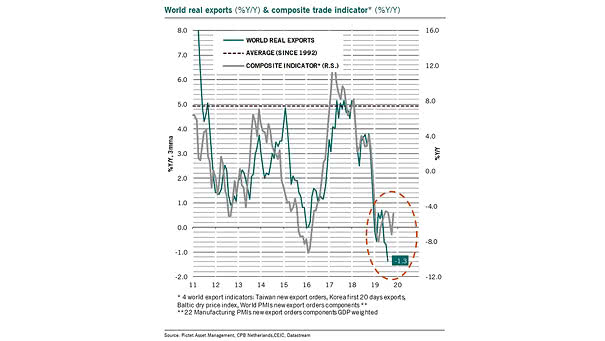
World Real Exports and Composite Trade Indicator Chart suggesting a recovery in world exports growth Image: Pictet Asset Management
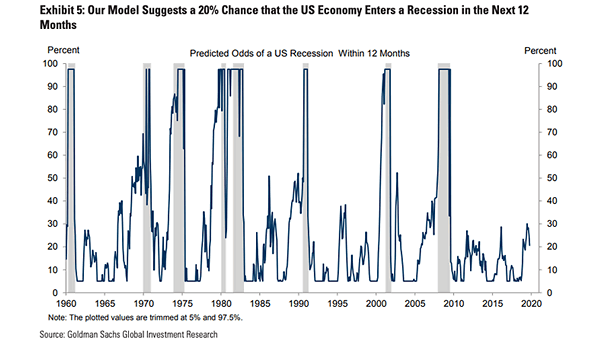
Predicted Odds of a U.S. Recession within 12 Months This chart suggests that the odds of a U.S. recession within 12 months have decreased to 20%. Image: Goldman Sachs Global Investment Research