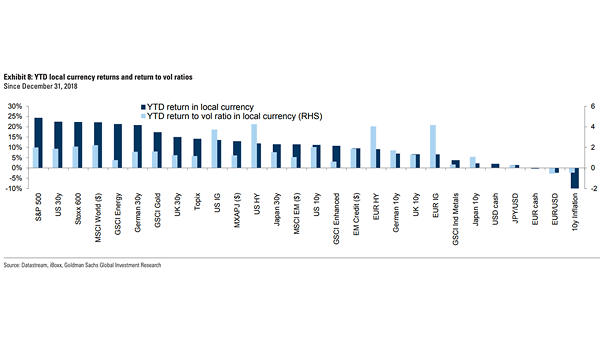
Local Currency Returns and Return to Vol Ratios in YTD 2019
Local Currency Returns and Return to Vol Ratios in YTD 2019 Chart showing what investors should have bought this year. Image: Goldman Sachs Global Investment Research
Local Currency Returns and Return to Vol Ratios in YTD 2019 Chart showing what investors should have bought this year. Image: Goldman Sachs Global Investment Research
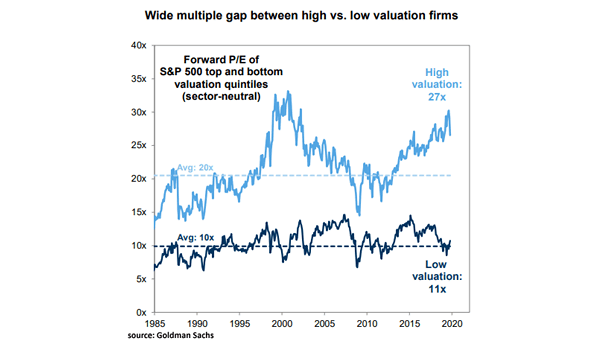
Forward P/E of S&P 500 Top and Bottom Valuation Quintiles The forward P/E of the top quintile of S&P 500 companies by valuation is 27 (avg: 20) vs. 11 (avg: 10) for the lowest quintile. Image: Goldman Sachs Global Investment Research
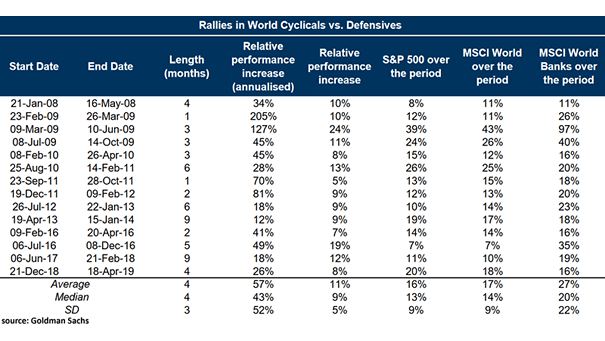
Rallies in World Cyclicals vs. Defensives Since the global financial crisis, average rallies in world cyclicals vs. defensives have lasted only four months. Image: Goldman Sachs Global Investment Research
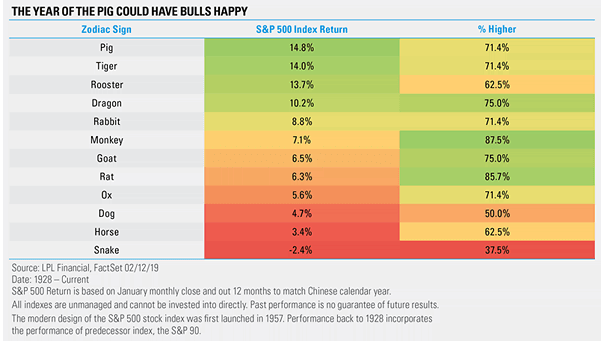
S&P 500 Index Return and Chinese Calendar Year The year of the Pig seems to be strong for U.S. equities this year. Image: Ryan Detrick, LPL Financial LLC
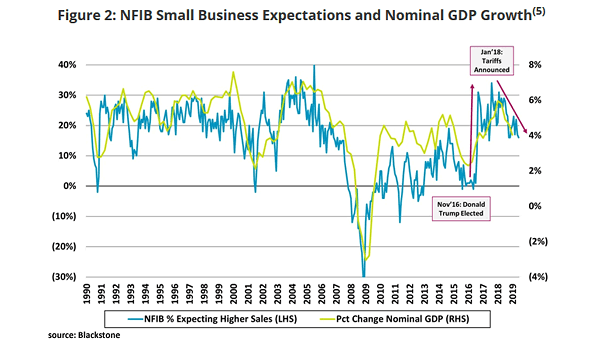
U.S. Small Business Sales Expectations and Nominal U.S. GDP Growth Chart showing the correlation between U.S. small business sales expectations and nominal U.S. GDP growth, and the impact of small businesses to the U.S. economy. Image: Blackstone
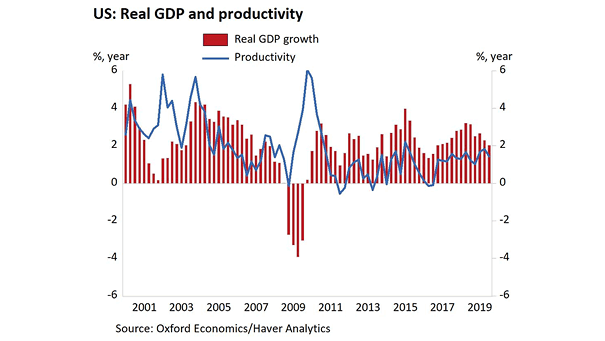
U.S. Real GDP and Productivity The U.S. economy is slowing down and productivity falls by most since 2015. Is the drop in productivity temporary? Image: Oxford Economics
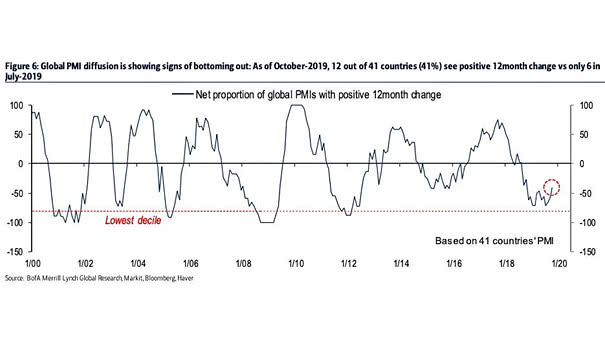
Net Proportion of Global PMI with Positive 12-Month Change There are signs of a bottom in global PMIs: 12 out of 41 countries see a positive 12-month change. This is double the number from July 2019. Image: BofA Merrill Lynch Global Research
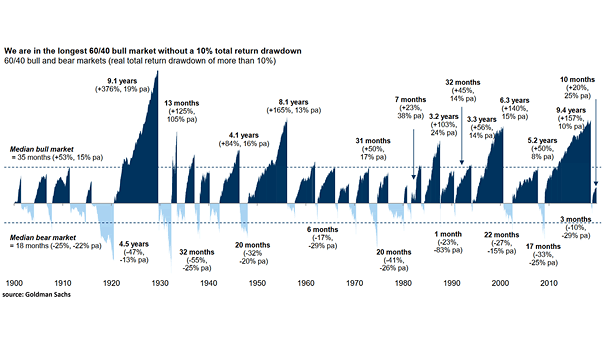
60/40 Portfolio – Bull and Bear Markets This is the longest bull market for balanced equity/bond portfolios in over a century, without a 10% total return drawdown. Image: Goldman Sachs Global Investment
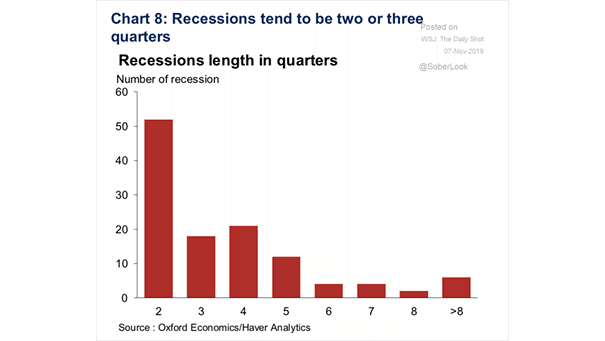
Recessions Length in Quarters Historically, recessions tend to be two or three quarters. Image: Oxford Economics
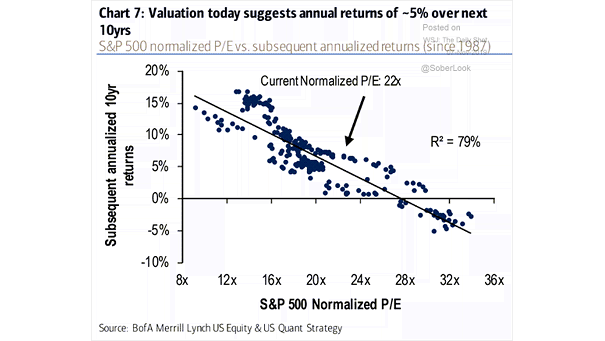
S&P 500 Valuation and Subsequent Annualized 10-Year Returns Chart suggesting annualized returns of approximately 5% over the next 10 years. Image: BofA Merrill Lynch Global Research
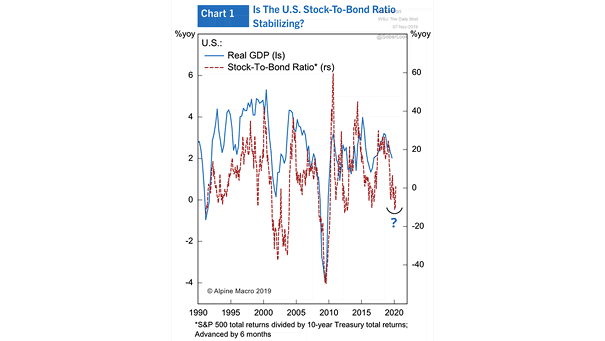
U.S. Stock-to-Bond Ratio Leads U.S. Real GDP Chart suggesting that the U.S. stock-to-bond ratio leads U.S. real GDP by 6 months, which could indicate higher GDP growth. Image: Alpine Macro