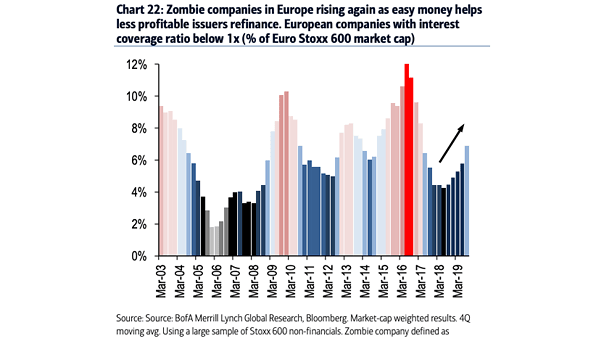
Zombie Companies in Europe
Zombie Companies in Europe After years of unprecedentedly easy monetary policy, zombie companies in Europe are back on the rise. Image: BofA Merrill Lynch Global Research
Zombie Companies in Europe After years of unprecedentedly easy monetary policy, zombie companies in Europe are back on the rise. Image: BofA Merrill Lynch Global Research
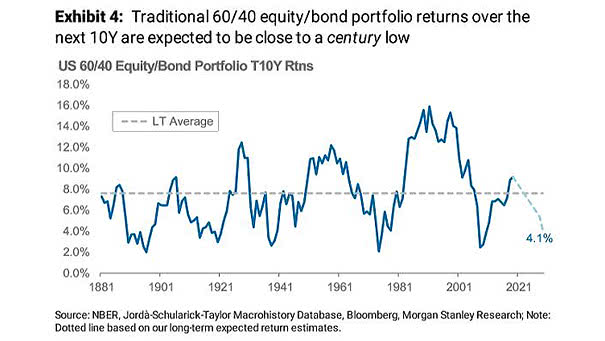
U.S. 60/40 Portfolio Returns Over the Next 10 Years Chart suggesting that the return of a U.S. 60/40 portfolio could slide near 100-year lows over the next decade, due to low yields, low growth and low inflation expectations. Image: Morgan Stanley Research
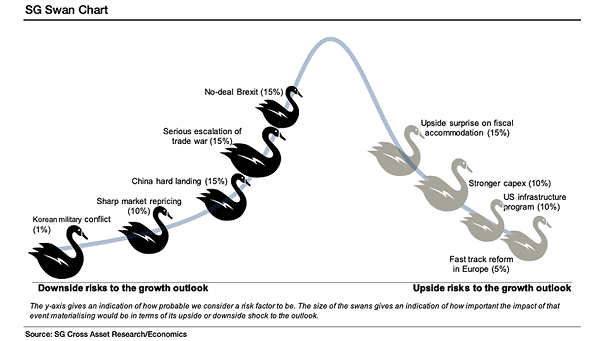
Upside and Downside Risks to the Growth Outlook – SG White & Black Swan Chart The SG swan chart shows upside and downside risks to growth forecasts on a one-year horizon. Image: Societe Generale Cross Asset Research
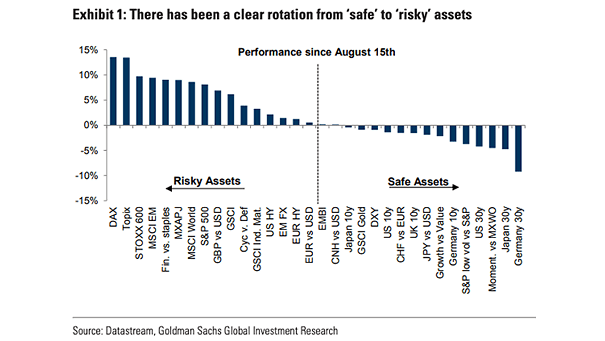
Rotation from Safe to Risky Assets The market is rotating. The chart clearly shows the big rotation taking place from “safe” to “risky” assets since mid-August 2019. Image: Goldman Sachs Global Investment Research
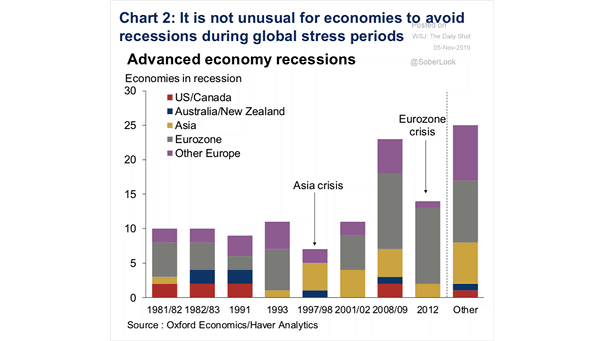
Advanced Economy Recessions During Global Stress Periods Interesting chart showing the number of advanced economies in recession during global stress periods. Image: Oxford Economics
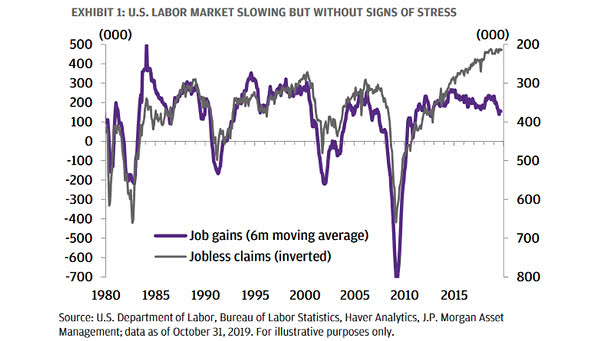
U.S. Labor Market: Jobs Gains and Jobless Claims The U.S. labor market is slowing, but historically, recessions have been preceded by a slowing in job gains and a pickup in jobless claims. Image: J.P. Morgan Asset Management
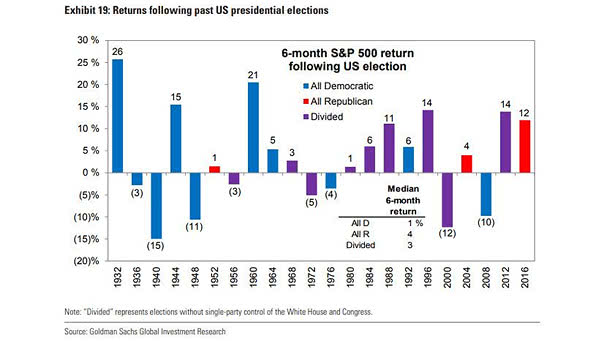
6-Month S&P 500 Return Following U.S. Election Since 1932, the median 6-month S&P 500 return for an all Republican sweep has been 4% vs. 1% for an all Democratic sweep, and 3% for a divided government. Image: Goldman Sachs Global Investment Research
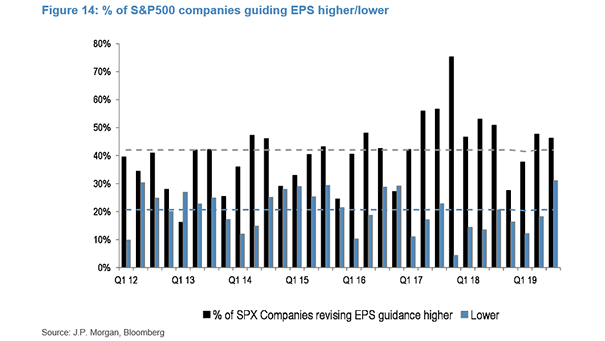
Percentage of S&P 500 Companies Guiding EPS Higher/Lower This quarter, the percentage of S&P 500 companies revising EPS guidance lower, is much higher than in previous quarters. Image: J.P. Morgan
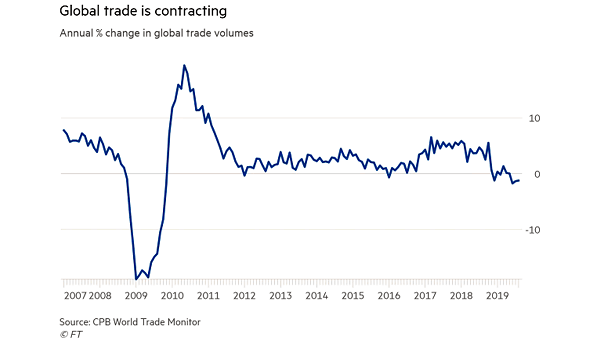
Global Trade Volume Chart showing weaker global trade volumes amid trade tensions. Image: Financial Times
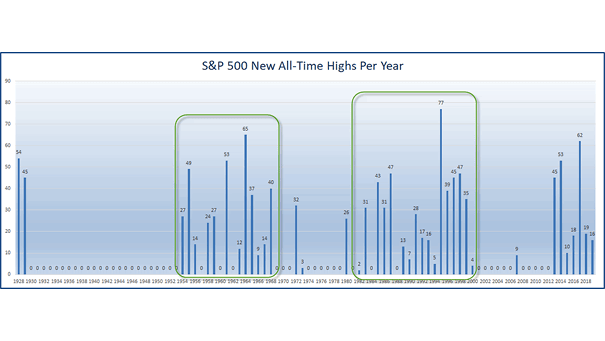
S&P 500 New All-Time Highs Per Year This year has the second most new highs ever. New all-time highs can last more than 10 years and tend to occur in clusters. Image: Ryan Detrick, LPL Financial LLC Click the Image to Enlarge
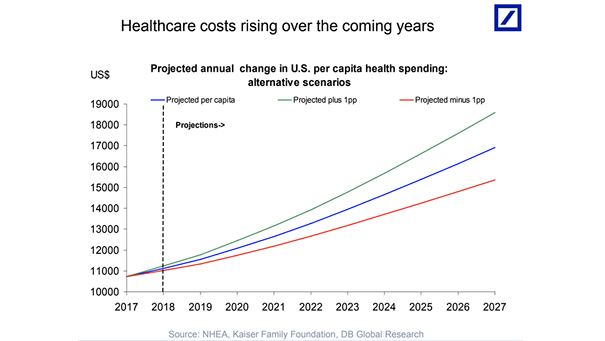
Projected U.S. Health Care Costs Over the next 10 years, the federal government is expected to spend $16 trillion on health care and $6 trillion on interest costs. Image: Deutsche Bank Global Research