U.S. Consumer Spending, Business Investment and U.S. GDP
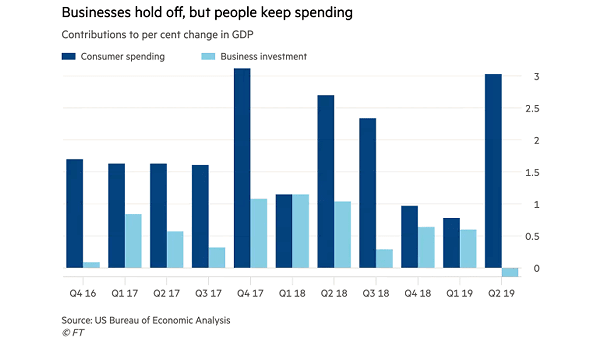
U.S. Consumer Spending, Business Investment and U.S. GDP Right now, consumer spending is the driving force behind the U.S. economy. Image: Financial Times
U.S. Consumer Spending, Business Investment and U.S. GDP Right now, consumer spending is the driving force behind the U.S. economy. Image: Financial Times
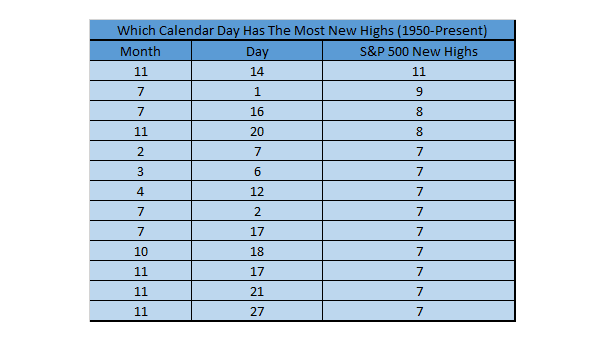
S&P 500 New Highs Since 1950, November 14 has the most S&P 500 new highs ever at 11. Image: Ryan Detrick, LPL Financial LLC
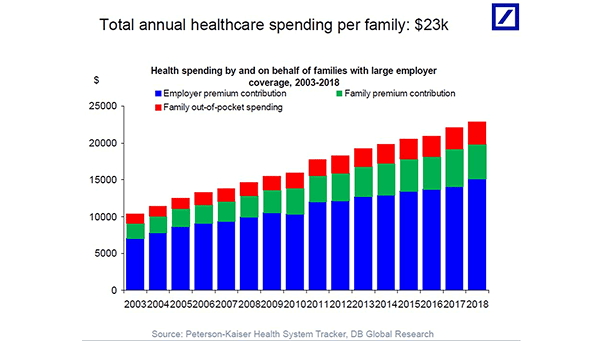
Total Annual Health Care Spending Per U.S. Family Headlines say there’s no inflation, but U.S. health care costs have skyrocketed. The annual health care cost for U.S. families is $23,000 vs. $10,000 in 2003. Image: Deutsche Bank Global Research
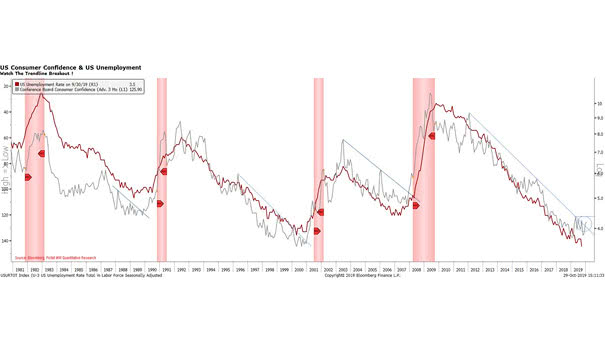
U.S. Consumer Confidence Leads U.S. Unemployment Chart suggesting that U.S. consumer confidence leads U.S. unemployment by three months. Image: Pictet Wealth Management
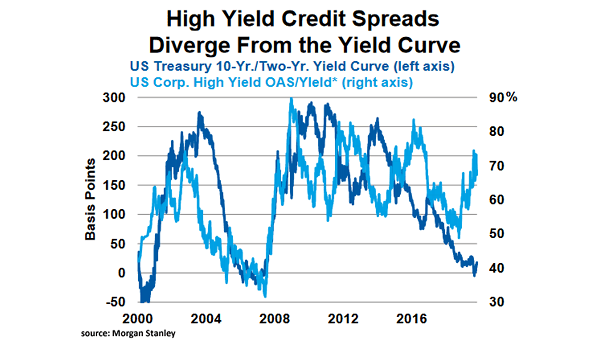
U.S. 10Y-2Y Yield Curve and U.S. High Yield Bonds Chart suggesting that high yield prices are not likely to perform well. Image: Morgan Stanley
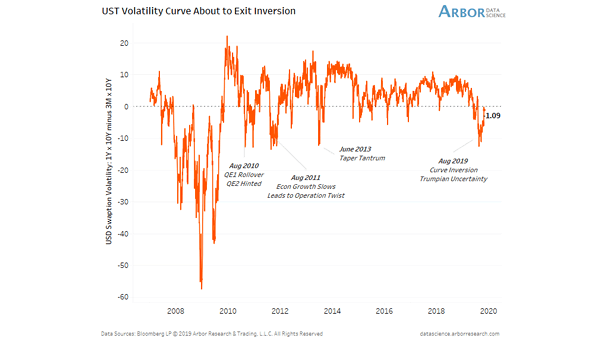
U.S. Treasuries Volatility Curve Short-term periods of inversion have been followed by higher U.S. Treasuries yields and tighter credit spreads. Image: Arbor Research & Trading LLC
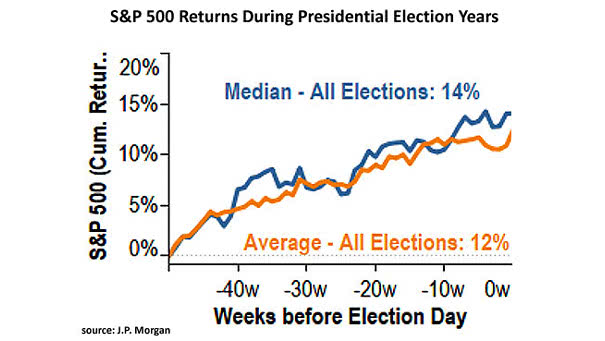
S&P 500 Returns During Presidential Election Years Historically, the S&P 500 has gained an average of 12% in the year before a presidential election. Image: J.P. Morgan
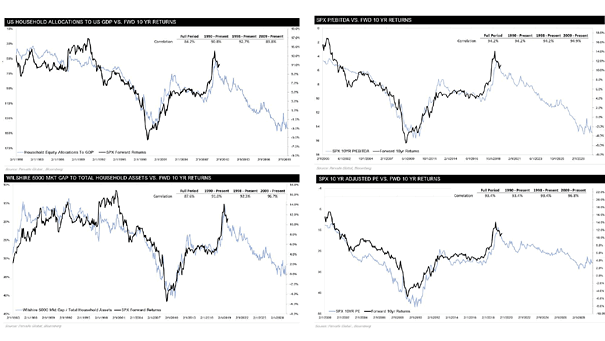
S&P 500 Forward 10 Year Returns Charts suggesting that S&P 500 returns will be weak for the next 10 years. Image: Pervalle Global Click the Image to Enlarge
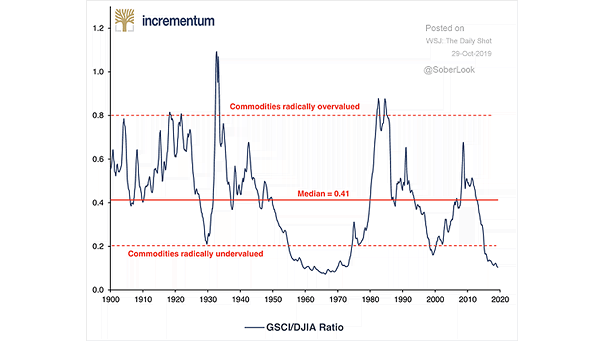
Commodities vs. Dow Jones Industrial Average Chart suggesting that commodities are very undervalued relative to the U.S. stock market. Image: Incrementum

U.S. Real GDP Forecast for 2019 and 2020 Wells Fargo does not yet see a recession in the U.S. and forecasts U.S. real GDP growth of 2.2% in 2019 and 1.7% in 2020 (as of October 2019). Image: Wells Fargo Securities, LLC
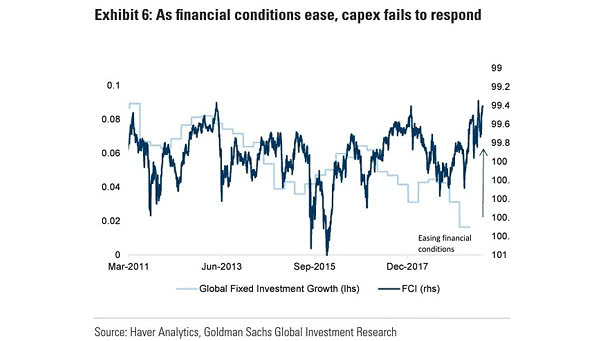
Financial Conditions and Capital Expenditures Easier financial conditions don’t boost capex, amid the current uncertainty over tariffs and the slowdown in global economies. Image: Goldman Sachs Global Investment Research