Share of Americans Who Own Stocks
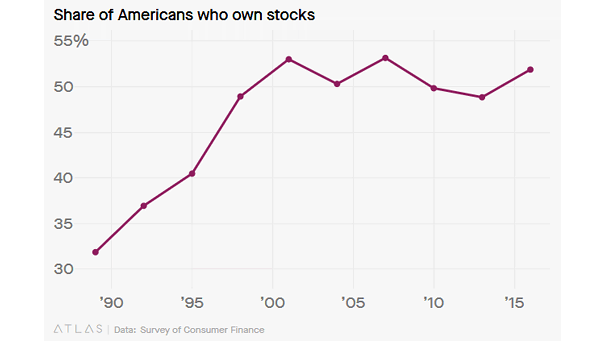
Share of Americans Who Own Stocks More and more Americans are invested in the stock market. 30 years ago, only about 30%. More than 50%, today. Image: Atlas, Survey of Consumer Finances
Share of Americans Who Own Stocks More and more Americans are invested in the stock market. 30 years ago, only about 30%. More than 50%, today. Image: Atlas, Survey of Consumer Finances
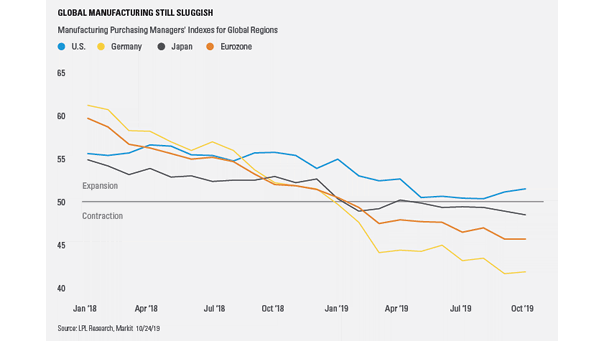
Global Manufacturing PMI Manufacturing PMI is still sluggish in the world, but it is trying to stop going down in the United States. Image: LPL Research
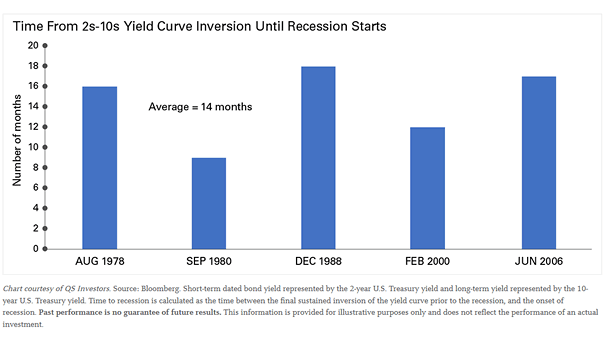
10Y-2Y Yield Curve Inversion Until U.S. Recession Starts An inverted yield curve doesn’t always mean that a recession is imminent. But historically, a sustained yield curve inversion has been a good indicator of recession. Image: Legg Mason
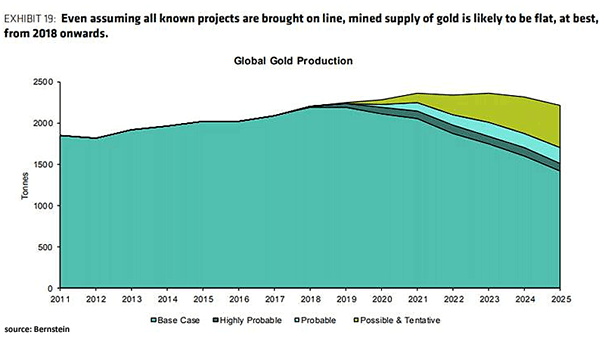
Global Gold Production Chart suggesting that gold is heading for a flat supply at best in the coming years, which could further support the price of gold. Image: Bernstein
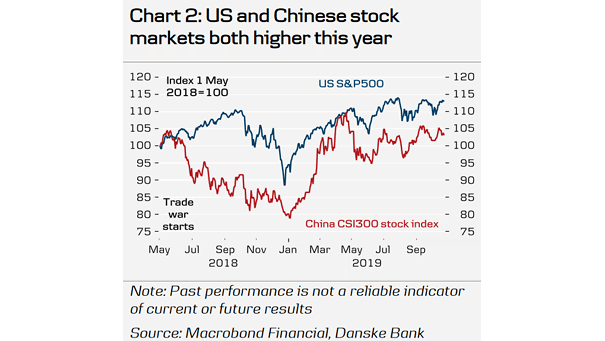
U.S. and China Stock Markets U.S. and China stock markets are both higher year-to-date, amid the trade war. Image: Danske Bank Research
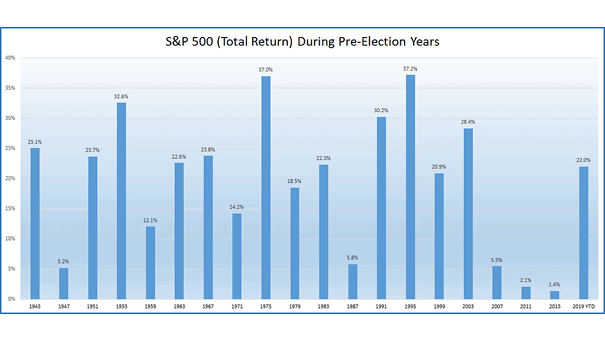
S&P 500 Total Return During Pre-Election Years “What we learn from history is that people don’t learn from history. And you certainly see that in financial markets all the time.” –Warren Buffett Image: Ryan Detrick, LPL Financial LLC
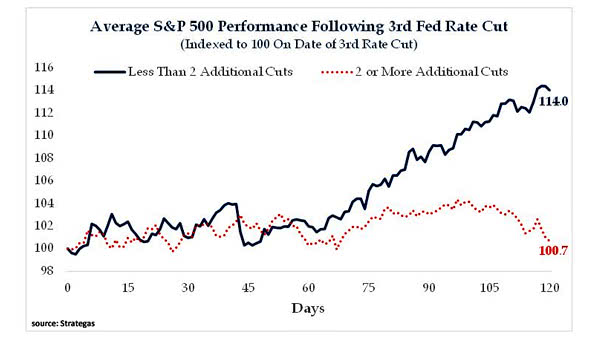
Average S&P 500 Performance Following 3rd Fed Rate Cut In the Fed rate cutting cycle, the chart shows the average S&P 500 performance following a 3rd Fed rate cut, with less than two additional cuts, and two or more additional cuts. Image: Strategas
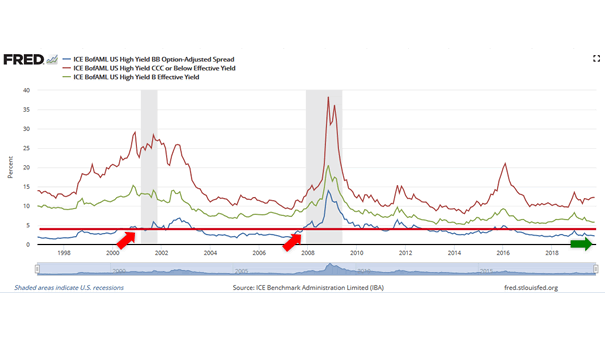
A Widening of High Yield Credit Spreads Is Very Useful to Predict a Recession Like a yield curve inversion and real interest rates above real GDP, a widening of high yield credit spreads is very useful to predict a recession. At the present time, the bond market is not concerned about credit risk.
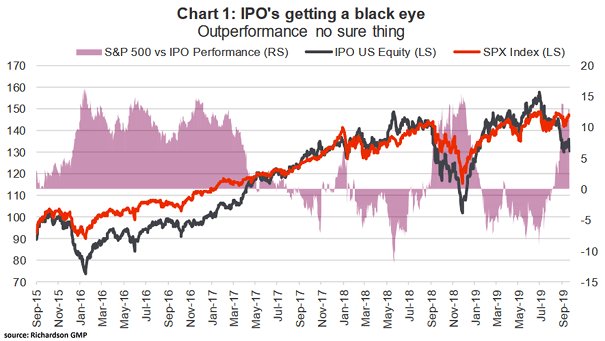
S&P 500 vs. IPO Performance The chart shows how IPOs have performed since 2015. Currently, investors seem reluctant to invest in high-risk, high-growth companies. Image: Richardson Wealth
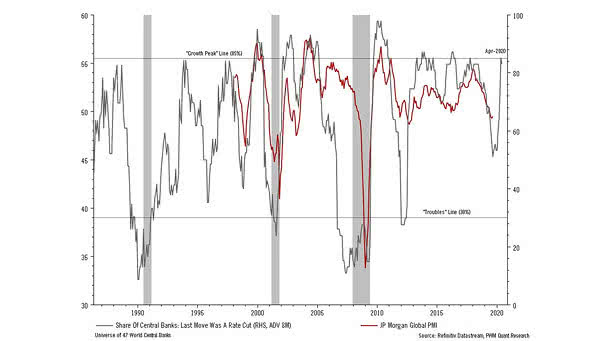
Central Bank Rate Cuts Lead Global Manufacturing PMI by 8 Months Charting suggesting that central banks rate cuts lead global manufacturing PMI by 8 months. Image: Pictet Wealth Management
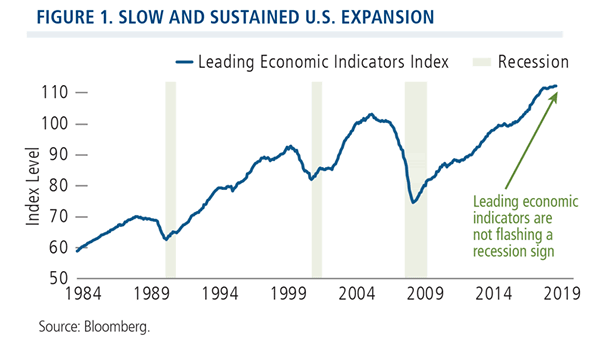
Leading Economic Index (LEI) for the U.S. and Recessions Leading economic indicators are still trending upward. The U.S. economy is growing, but more slowly. Image: Calamos Investments LLC