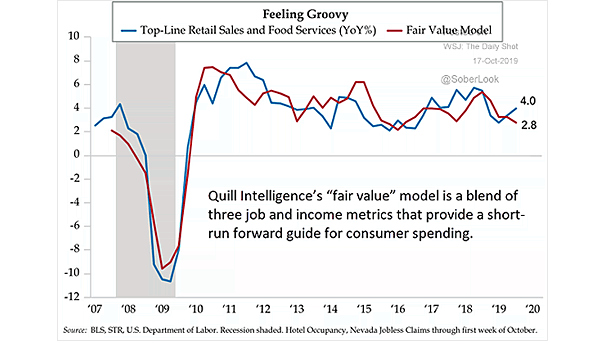
U.S. Retail Sales and Food Services vs. Fair Value Model
U.S. Retail Sales and Food Services vs. Fair Value Model After disappointing U.S. retail sales in September, this chart provides a good forward guide for U.S. consumer spending. The Fair Value Model leads consumption and includes: ASA Staffing Index (temps), spread between good unemployment (job leavers) and bad unemployment (job losers), and forward-looking income expectations.…