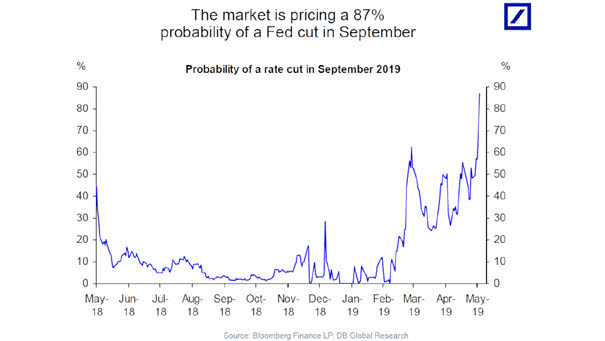
Different Type of Bear Markets

Different Type of Bear Markets While both cyclical and event-driven bear markets tend to drop by approximately 30%, their durations vary. Cyclical bear markets average two years, whereas event-driven ones last about eight months and recover within a year. Image: Goldman Sachs Global Investment Research

S&P 500 Bear Markets

S&P 500 Bear Markets Should the S&P 500 transition into a bear market, history shows that patient investors are often rewarded in the year and two-year windows after the bear market starts. Image: Carson Investment Research

Waterfall Declines in the S&P 500

Waterfall Declines in the S&P 500 Contrary to the widespread belief that markets systematically retest lows, analysis of waterfall declines since 1929 reveals that such occurrences are far from consistent. Image: Fundstrat Global Advisors, LLC

S&P 500 and Breadth-Based Stock Market Bottom Signal

S&P 500 and Breadth-Based Stock Market Bottom Signal A signal indicating a potential market bottom, based on extreme breadth levels, has been triggered. Historically, such signals often precede market turning points but are not infallible and can sometimes appear prematurely. Image: Bloomberg

ISABELNET Cartoon of the Day

ISABELNET Cartoon of the Day If the U.S. trade deficit is a national emergency, then the small-cap and Nasdaq bear markets need life support! Happy “Hump” Day, Everyone! 🐫🐪😎

Consensus Estimated Margin Growth

Consensus Estimated Margin Growth Slower economic growth and rising costs are expected to lead to a decline in S&P 500 margin estimates later this year. Image: Goldman Sachs Global Investment Research

Risk Appetite Indicator for Different Asset Classes

Risk Appetite Indicator for Different Asset Classes Investors have sharply shifted toward risk aversion due to escalating tariff policies and eroding market visibility. Image: Goldman Sachs Global Investment Research

Bond Volatility – MOVE Index

Bond Volatility – MOVE Index The MOVE index, indicating the implied volatility of U.S. Treasury options, has recently reached its highest level since 2023, reflecting heightened uncertainty and broader financial instability. Image: The Daily Shot

Probability of U.S. Recession

Probability of U.S. Recession The rise in the one-year recession probability based on the S&P 500 and BBB spread is seen as a negative sign, highlighting economic risks that could affect market sentiment and change investment strategies. Image: J.P. Morgan

The 15 Worst Q1 Returns for the S&P 500 and What Happened Next

The 15 Worst Q1 Returns for the S&P 500 and What Happened Next A weak Q1 for the S&P 500 often sets the tone for lackluster performance in the remaining quarters, with data showing a median return of just 3.0% for the final three quarters. Image: Carson Investment Research

S&P 500 Bear Markets

S&P 500 Bear Markets S&P 500 bear markets tied to recessions don’t end before the recession starts. Those without a recession are rare and usually short. Image: TS Lombard