Demographics and Interest Rates
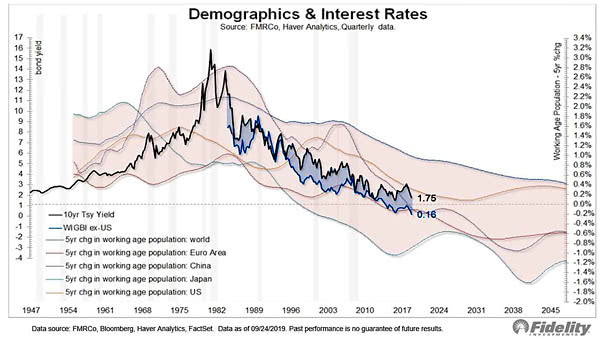
Demographics and Interest Rates Interesting chart suggesting that demographics explain bond yields. Image: Fidelity Investments
Demographics and Interest Rates Interesting chart suggesting that demographics explain bond yields. Image: Fidelity Investments
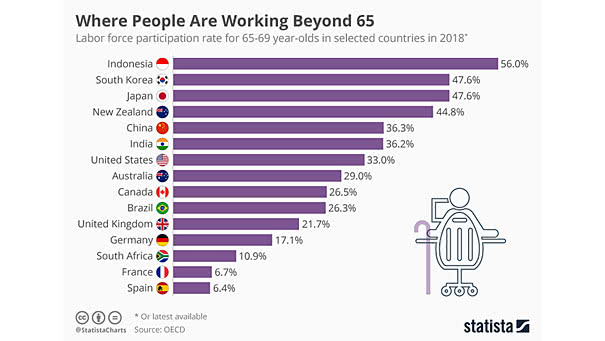
Labor Force Participation Rate for 65-69 Year-Olds in Selected Countries This chart shows the huge disparity in employment rates for 65-69 year-olds across different countries. Image: Statista
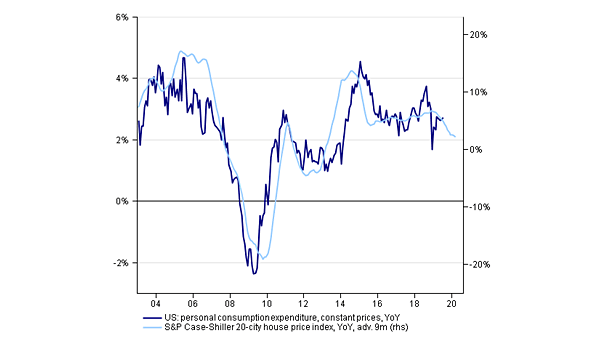
Home Prices Lead U.S. Consumption This chart suggests that home prices lead U.S. consumption by 9 months. Image: Nordea, Sebastian Dypbukt Källman
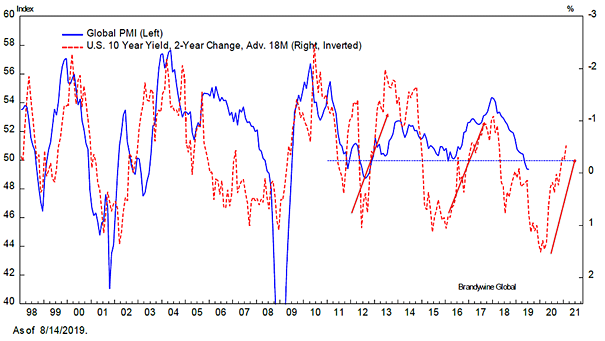
U.S. 10-Year Yield Leads Global PMI This interesting chart suggests that the U.S. 10-year yield (2-year change) leads global PMI by 18 months. Source: Macrobond and Brandywine Global
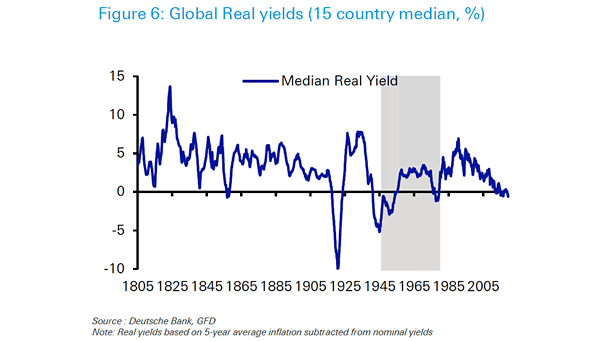
Global Real Yields Since 1805 Negative real yields are an “opportunity” for any government to refinance their debt. Image: Deutsche Bank
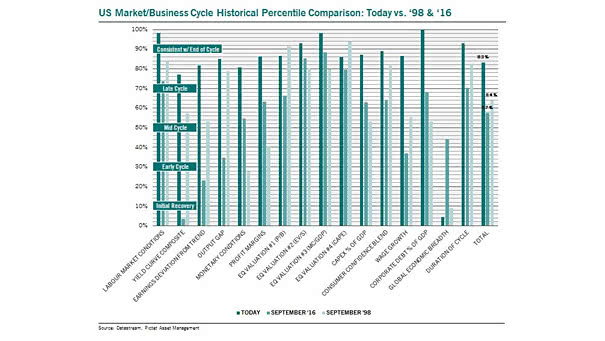
U.S. Market/Business Cycle Historical Percentile Comparison: Today vs. 1998 & 2016 This great chart suggests that the current U.S. business cycle is in a typical late-cycle phase. Image: Pictet Asset Management
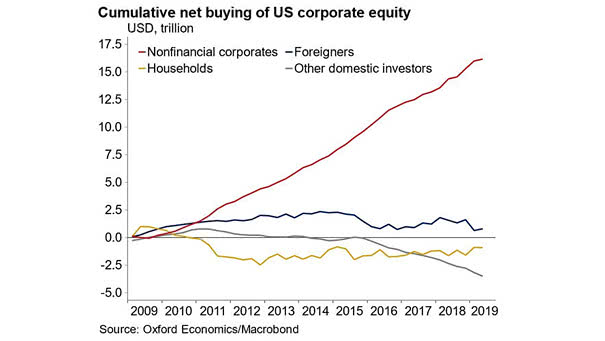
Buybacks – Cumulative Net Buying of U.S. Corporate Equity This chart shows that since 2009, buybacks have been the source of the rally in the U.S. stock market. Image: Oxford Economics, Macrobond
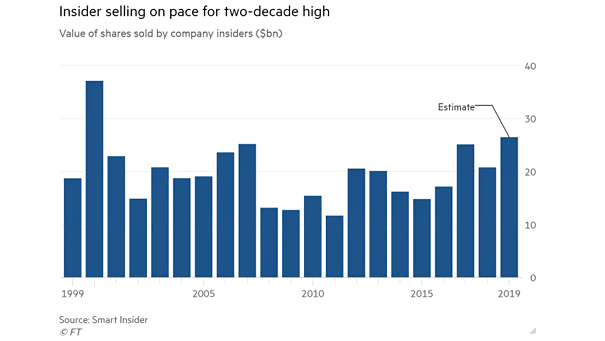
U.S. Insider Stock Sales and Recessions In the United States, insider stock sales rise at their highest level in about 20 years, as recession worries mount. Image: Financial Times
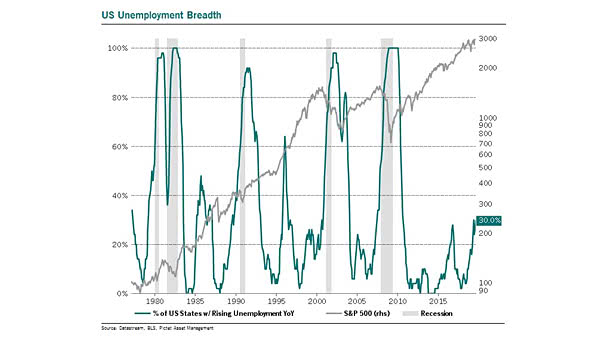
U.S. Unemployment Breadth and S&P 500 Year-over-year, the U.S. unemployment rate is rising in 30% of U.S. states, up from 18% in December 2018. Image: Pictet Asset Management
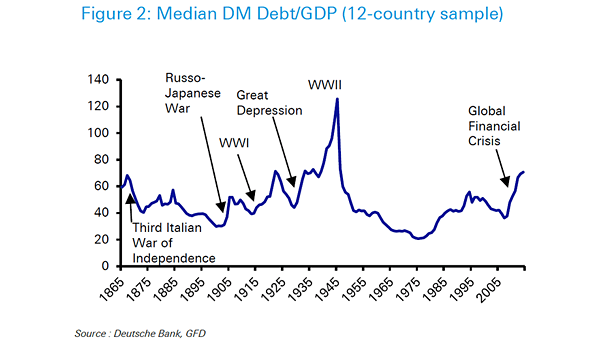
Median Developed Market Debt to GDP The total debt to gross domestic product is going back to 1865 for 12 developed countries. Image: Deutsche Bank
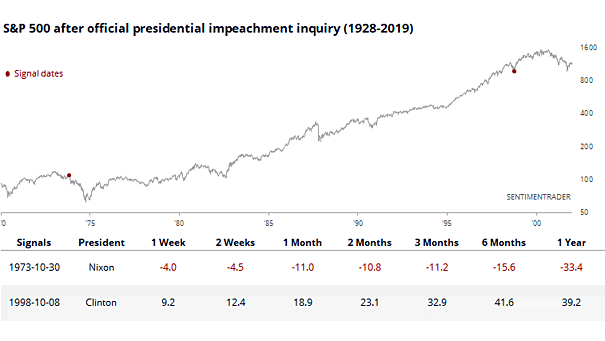
S&P 500 After Official Presidential Impeachment Inquiry Chart showing that two presidential impeachment inquiries had two different results. Image: Sentimentrader