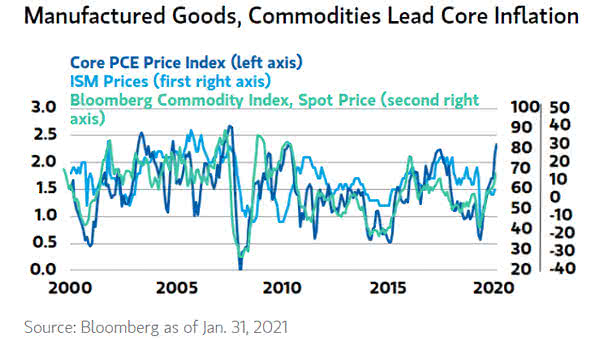
Inflation – U.S. ISM Services Prices vs. Super Core PCE

Inflation – U.S. ISM Services Prices vs. Super Core PCE History shows the U.S. ISM Services Prices Index tends to lead super core inflation by five months, which means sticky prices aren’t going anywhere soon. Image: Deutsche Bank
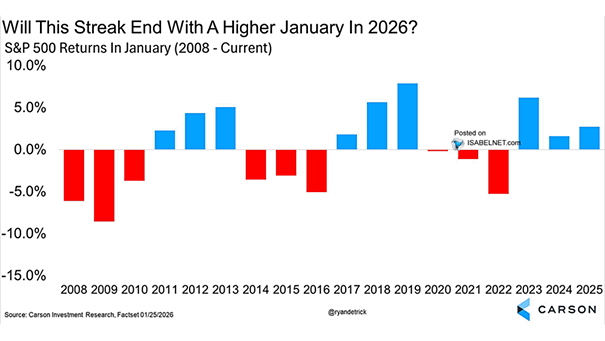
S&P 500 Returns in January

S&P 500 Returns in January The S&P 500 is up 1% so far this month. January has finished higher three years in a row. Could this be the fourth? Since 1950, when January finishes in the green, the rest of the year has risen 87% of the time. Image: Carson Investment Research

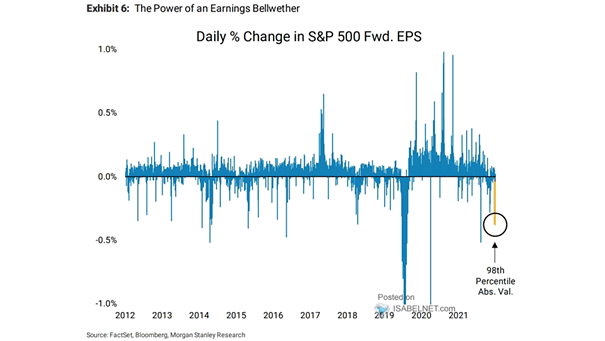
Valuation – Mega-Cap Tech PEG Ratio

Valuation – Mega-Cap Tech PEG Ratio Despite relying on forward growth estimates that often move, the Mega-Cap Tech PEG ratio (P/E to CY3 EPS growth) has fallen sharply, echoing the lows of 2022. Image: Goldman Sachs Global Investment Research

YTD Returns of Select Equity Indices

YTD Returns of Select Equity Indices Wall Street has lost some spark. The KOSPI, fired up by semiconductor leaders, has surged 15% this year, dwarfing the S&P 500’s and Nasdaq 100’s modest 1% gains. Image: Goldman Sachs Global Investment Research

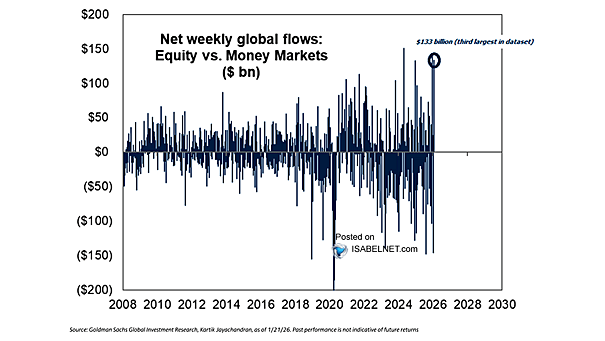
Net Weekly Global Flows: Equity vs. Money Markets

Net Weekly Global Flows: Equity vs. Money Markets Strong equity inflows and shrinking money market assets show investors are pulling cash out of safe havens and putting it back to work in stocks, giving new life to the “cash on the sidelines” story. Image: Goldman Sachs Global Investment Research

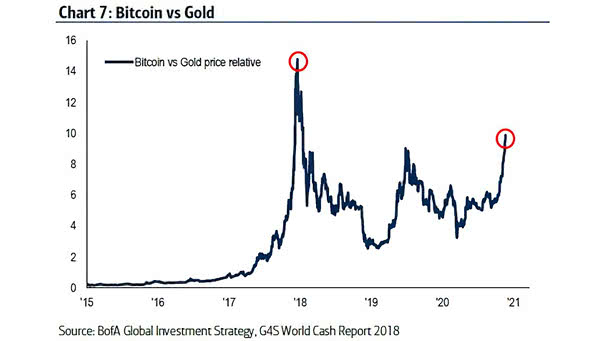
Gold vs. Bitcoin

Gold vs. Bitcoin The gap between gold and bitcoin has widened in recent weeks. Safe‑haven flows have lifted gold, while bitcoin has been trading more like a high‑beta risk asset, closely tracking tech and growth stocks. Image: MarketDesk Research

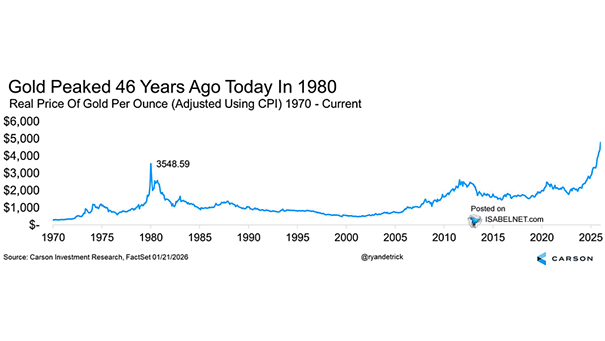
Real Price of Gold Per Ounce

Real Price of Gold Per Ounce Gold’s nominal price has climbed past its 1980 peak, but once you factor in inflation, it’s far less frothy than it looks. The market hasn’t lost its head, at least not yet. Image: Carson Investment Research

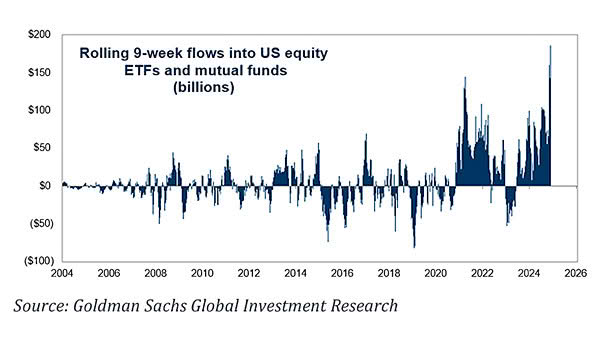
S&P 500 and Equity ETF Flows

S&P 500 and Equity ETF Flows Equity ETFs remain money magnets, pulling in about $5.6 billion a day since the start of the year, up from $3.5 billion in 2025. Flows don’t lie: risk appetite is alive and well. Image: Strategas Asset Management

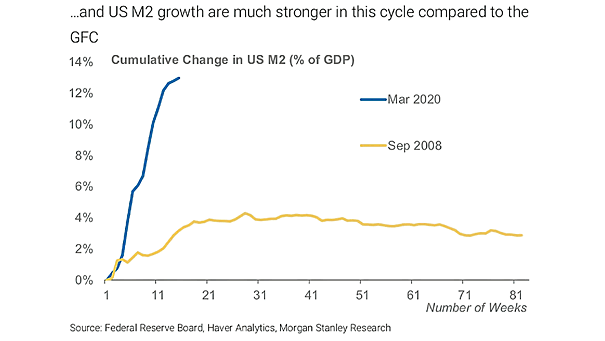
U.S. M2 Money Supply

U.S. M2 Money Supply With M2 up 4.27% year on year, the money supply is lagging behind economic growth, pointing to cooling inflation rather than trouble. Image: Real Investment Advice

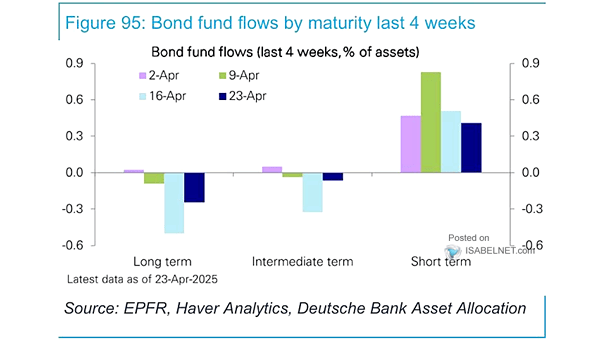
Bond Fund Flows (Last 4 Weeks)

Bond Fund Flows (Last 4 Weeks) Bond funds keep drawing strong inflows as investors look for yield and stability in a world of moderating inflation and lingering uncertainty. Image: Deutsche Bank Asset Allocation