Investor Sentiment – NAAIM Exposure Index and S&P 500
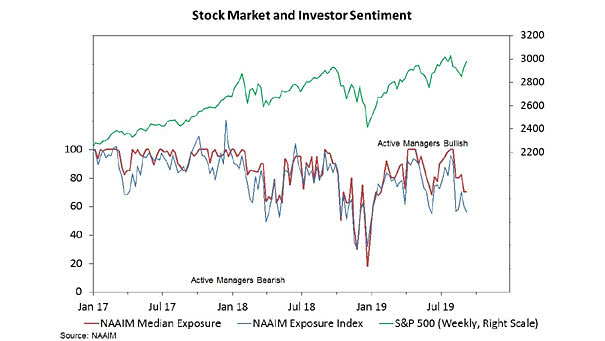
Investor Sentiment – NAAIM Exposure Index and S&P 500 NAAIM Exposure Index dropped to 56.15% (median exposure at 70%). NAAIM members’ optimism was short-lived. Image: Willie Delwiche, Baird
Investor Sentiment – NAAIM Exposure Index and S&P 500 NAAIM Exposure Index dropped to 56.15% (median exposure at 70%). NAAIM members’ optimism was short-lived. Image: Willie Delwiche, Baird
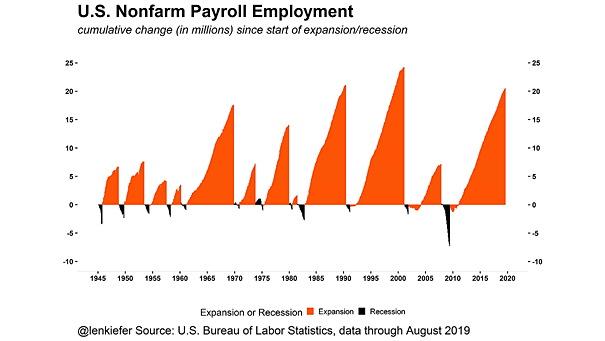
U.S. Nonfarm Payroll Employment During this business cycle, America has added over 20 million jobs. Image: Leonard Kiefer
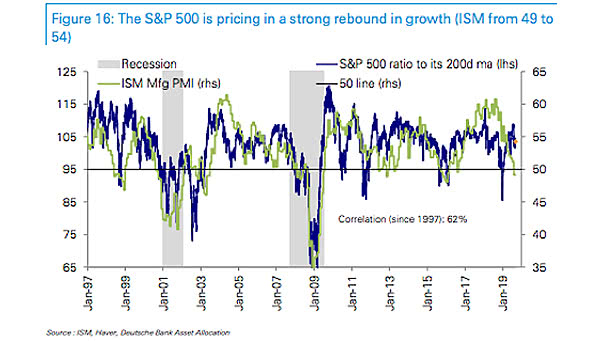
U.S. ISM Manufacturing Index vs. S&P 500 Chart showing that the S&P 500 continues to price in a strong rebound in the ISM, from 49 to 54 (R = 0.62). Image: Deutsche Bank Global Research
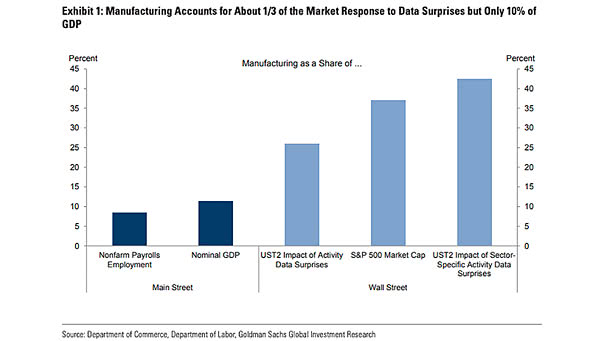
Manufacturing’s Share of the U.S. Economy Manufacturing accounts for only 10% of U.S. GDP, but 25% to 45% of the market response. Image: Goldman Sachs Global Investment Research
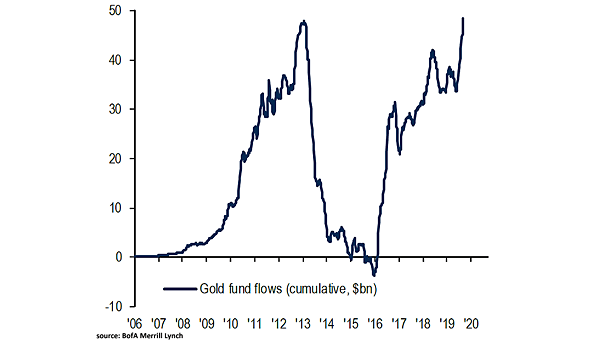
Gold Fund Flows Investors are flooding into gold as fears of a global slowdown mount. Image: BofA Merrill Lynch
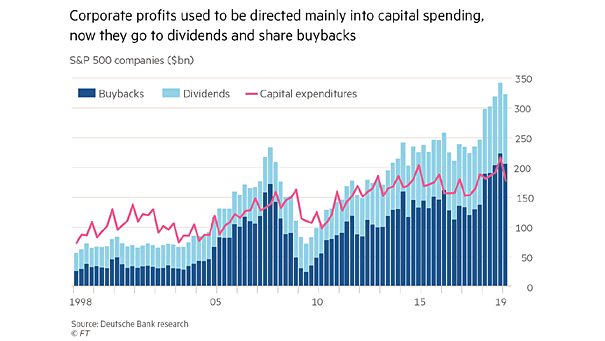
U.S. Corporate Profits, Capital Expenditures, Dividends and Buybacks What would happen if U.S. companies reinvested instead of buying their own shares and paying dividends? Image: Financial Times
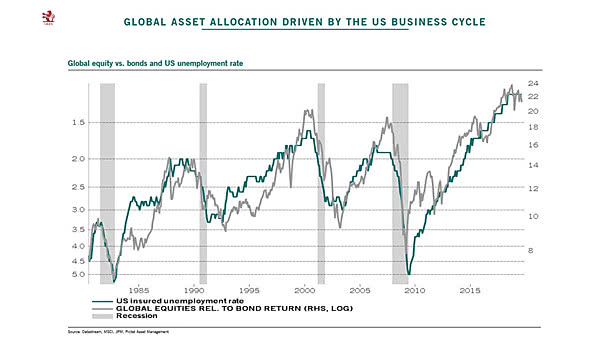
Global Equity vs. Bonds and U.S. Unemployment Rate and Recessions The chart shows that the U.S. business cycle drives global asset allocation and suggests a possible U.S. recession in 2020. Image: Pictet Asset Management
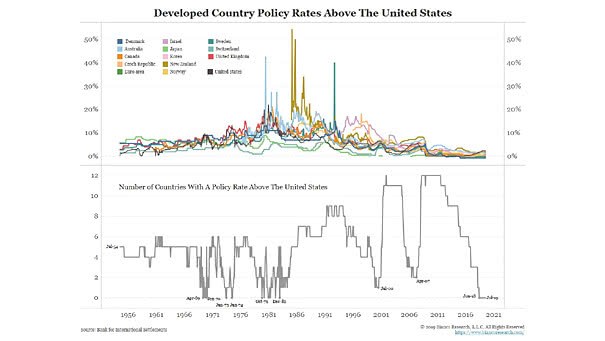
Developed Country Policy Rates Above the United States Look for the mistake: the number of countries with a policy rate above the U.S. is zero. Image: Bianco Research
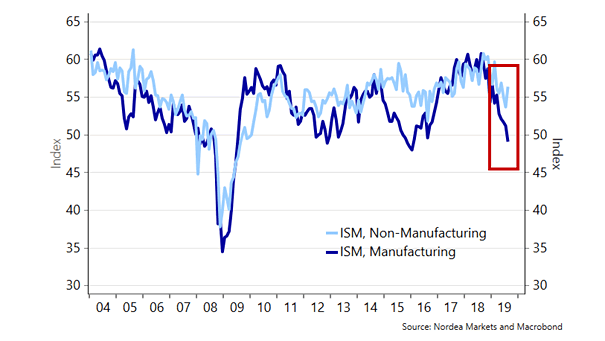
U.S. ISM Manufacturing Index vs. U.S. ISM Non-Manufacturing Index Although the non-manufacturing sector’s growth slowed, it continues to reflect strength for now. Image: Nordea and Macrobond
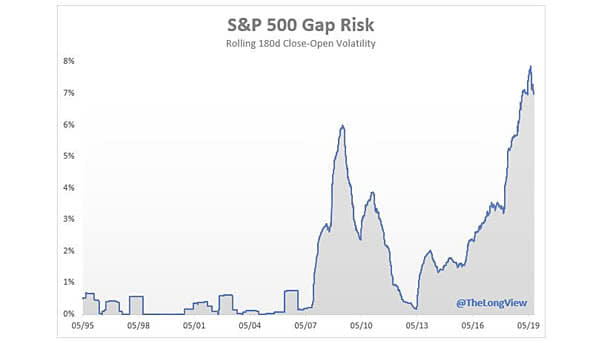
S&P 500 Gap Risk The S&P 500 Index is subject to significant gap risks under the Presidency of Donald Trump. Image: Hayek and Keynes
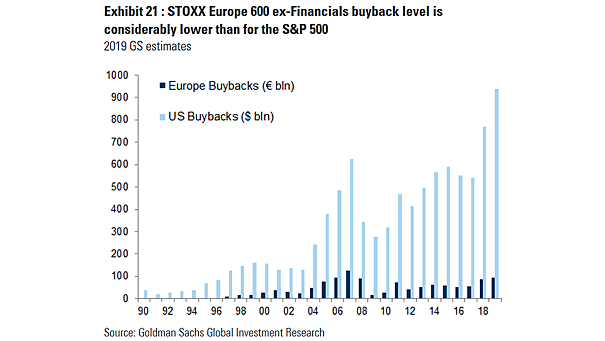
U.S. Buybacks vs. European Buybacks This chart shows that European buybacks are not as popular as they are in the U.S.. Image: Goldman Sachs Global Investment Research