U.S. Stock Market – Earnings and Valuation
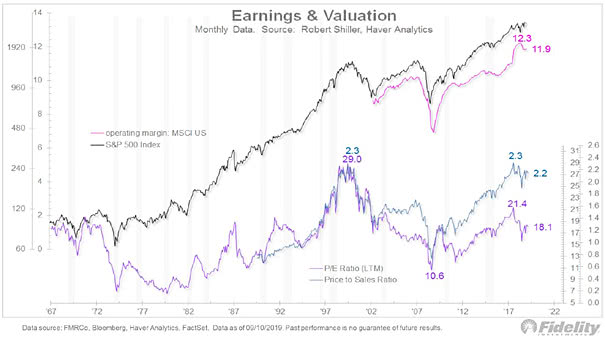
U.S. Stock Market – Earnings and Valuation The valuation is high relative to history, but not near historical extremes. The U.S. stock market should remain under pressure until Q3 earnings season. Image: Fidelity Investments