U.S. Buybacks vs. European Buybacks
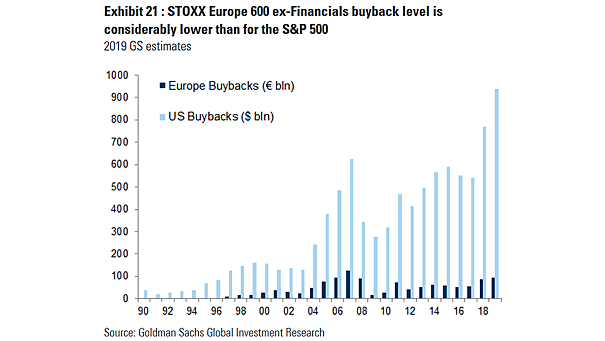
U.S. Buybacks vs. European Buybacks This chart shows that European buybacks are not as popular as they are in the U.S.. Image: Goldman Sachs Global Investment Research
U.S. Buybacks vs. European Buybacks This chart shows that European buybacks are not as popular as they are in the U.S.. Image: Goldman Sachs Global Investment Research
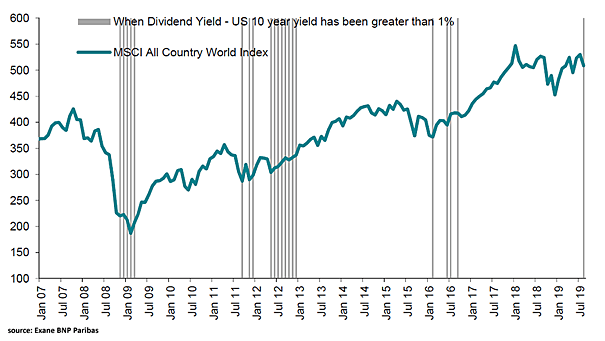
MSCI All Country World Index (ACWI) Dividend Yield Less U.S. 10-Year Yield When the spread has been greater than 1%, it has been a good support for the MSCI All Country World Index. Image: Exane BNP Paribas
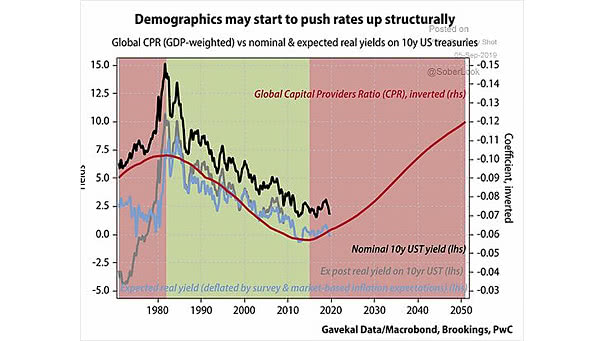
Demographics and U.S. 10-year Treasury Yield The trend in global savings has turned. The chart suggests that the dis-saving phase is likely to be inflationary. Image: Gavekal, Macrobond
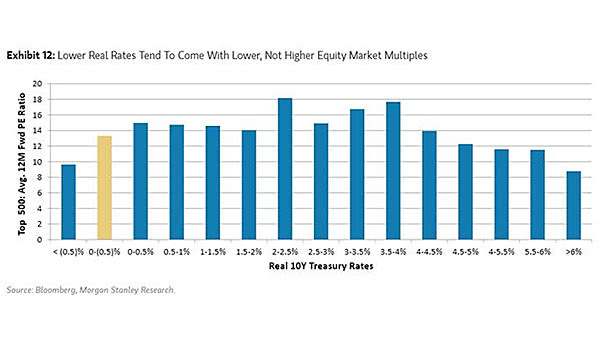
Forward PE Ratio and Real 10-Year Treasury Rate Lower real 10-year Treasury rates suggest lower equity market multiples. Image: Morgan Stanley Research
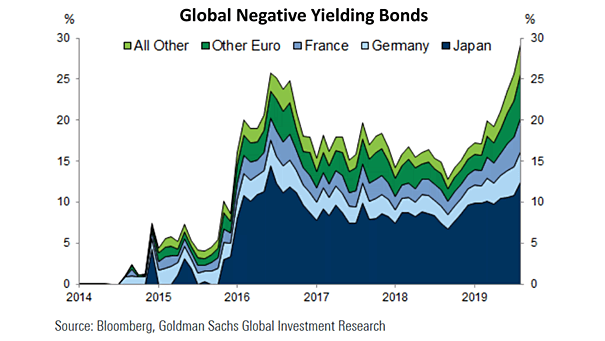
Global Negative Yielding Bonds This chart shows all bonds in the world at negative interest rates. Image: Goldman Sachs Global Investment Research
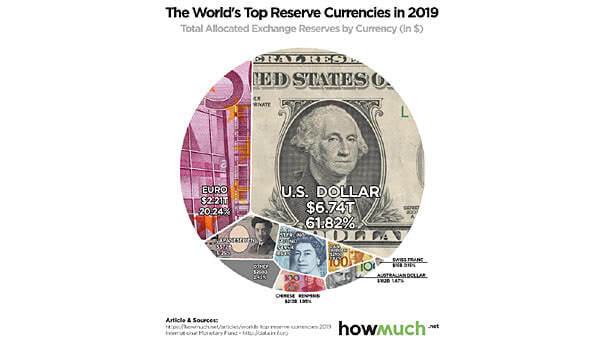
Total Allocated Exchange Reserves by Currency The U.S. dollar represents 61% of all central bank foreign reserves. And the total value of all currencies held in foreign exchange reserves is almost $11 trillion. Image: howmuch.net
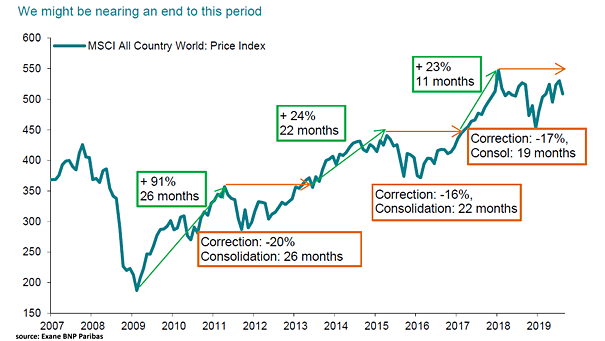
MSCI All Country World Index (ACWI) – Period of Consolidation Exane is bullish and suggests that the MSCI ACWI might be nearing an end to this period of consolidation. Image: Exane BNP Paribas
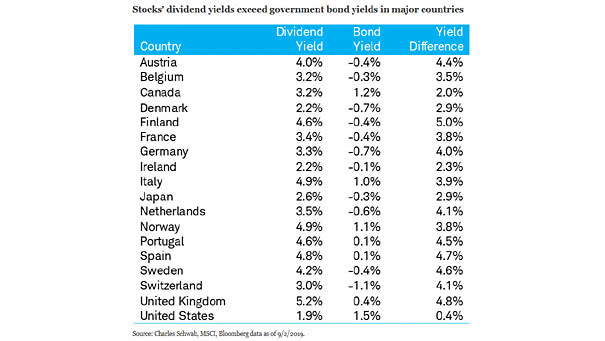
Stocks Dividend Yields Exceed Government Bond Yields in Major Countries In major countries, dividend yields are now significantly higher than yields on 10-year bonds. Image: Charles Schwab
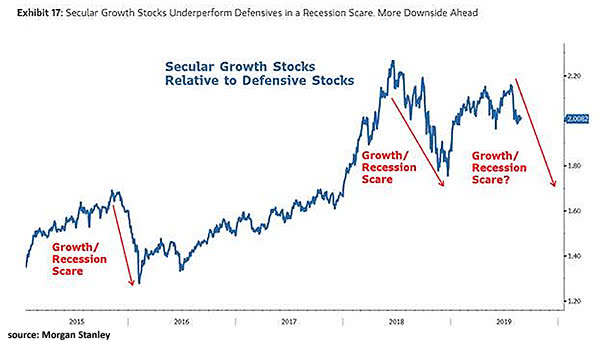
Secular Growth Stocks Relative to Defensive Stocks More downside ahead? This chart suggests that secular growth stocks are at risk. Image: Morgan Stanley Research
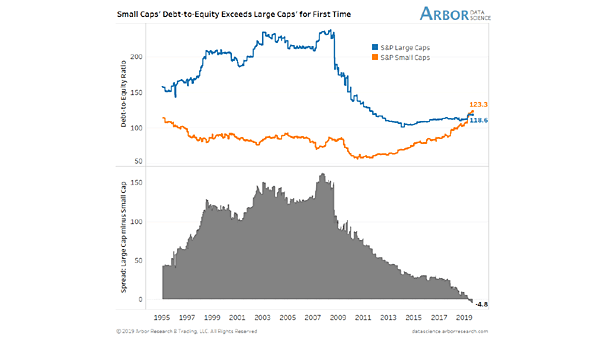
Small Caps Debt-to-Equity Exceeds Large Caps The debt-to-equity ratio of small caps exceeds large caps for the first time. Image: Arbor Research & Trading LLC
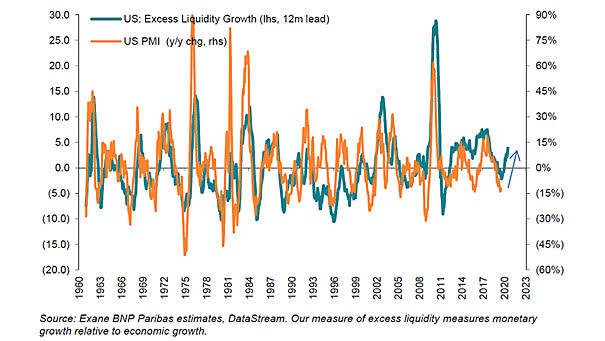
U.S. Excess Liquidity Leads U.S. PMI This chart suggests that U.S. excess liquidity leads U.S. PMI by 12 months. U.S. PMI could bounce back in 2020. Image: Exane BNP Paribas