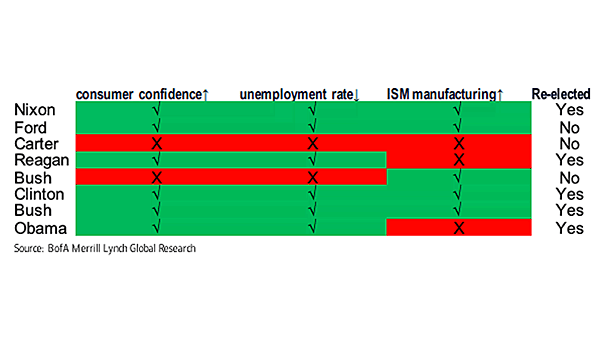
Fed Dovish Pivot – Stimulus Hopes Support Risk Appetite
Fed Dovish Pivot – Stimulus Hopes Support Risk Appetite Growth sentiment appears to be stabilizing, due to optimism about fiscal policy. Image: Goldman Sachs Global Investment Research
Earnings, Margins and Valuation Considering earnings growth, operating margin and valuation, the S&P 500 should remain under pressure until Q3 earnings season. Image: Fidelity Investments
Effect of the Trade War on U.S. Real GDP Growth Assuming no further escalation, the trade war drag on U.S. growth is expected to peak at about -0.4% in the second half of 2019. Image: Goldman Sachs Global Investment Research
U.S. Yield Curve 1M to 30Y and Correlation Against Fed Funds Effective Rate According to the chart, a 75bp cut is required to normalize the term structure of interest rates. Image: Fundstrat Global Advisors, LLC
Demographics – Forecasting U.S. GDP This chart suggests that aging population is weighing down growth. Image: Arbor Research & Trading LLC
Equity Valuations This chart shows that equity valuations are not very cheap, but not stretched either. Image: Pictet Wealth Management
G4 Central Banks Monetary Policy Rate If the trend in G4 central banks monetary policy rates continues, this chart suggests that we could see -4% in 2030. Image: Nordea and Macrobond
Percentage of Euro IG Credit Trading in Various Yield Buckets and Negative Yields This chart is another example of negative-yielding debt, which poses major risks for investors. Image: BofA Merrill Lynch
Different Holders of DM Government Debt The chart shows the historical breakdown of different holders of DM government bonds and overall DM debt-to-GDP. Even with QE, central bank government bond holdings are below historical peaks. Image: BlackRock Investment Institute
U.S. Jobless Claims Lead the Unemployment Rate This chart suggests that U.S. jobless claims lead the unemployment rate by 7 months. U.S. initial claims for unemployment fall more than expected to 209,000. Image: Oxford Economics
U.S. Jobless Claims and Recessions Before a recession, U.S. initial jobless claims bottomed. Image: Jeroen Blokland