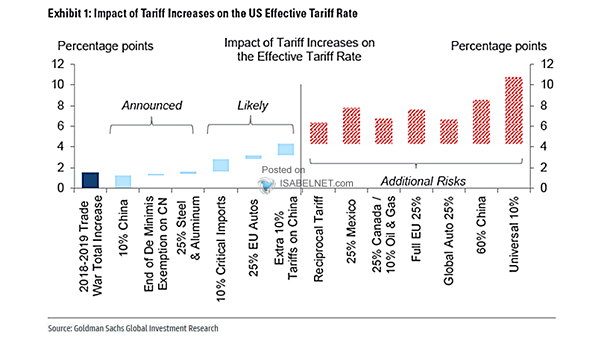
U.S. Effective Tariff Rate
U.S. Effective Tariff Rate A 19% rise in the effective U.S. tariff rate would significantly slow economic growth and sharply increase recession risk, with broad spillover effects on inflation, employment, and overall business confidence. Image: Goldman Sachs Global Investment Research