EUR/USD and 10-Year Rates Differential
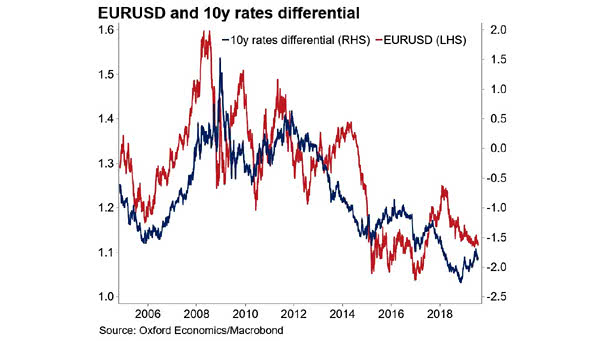
EUR/USD and 10-Year Rates Differential The chart shows the Euro vs. US Dollar (EUR/USD) and how a 10-year rates differential corresponds to a stronger or weaker US dollar. Image: Oxford Economics, Macrobond
EUR/USD and 10-Year Rates Differential The chart shows the Euro vs. US Dollar (EUR/USD) and how a 10-year rates differential corresponds to a stronger or weaker US dollar. Image: Oxford Economics, Macrobond
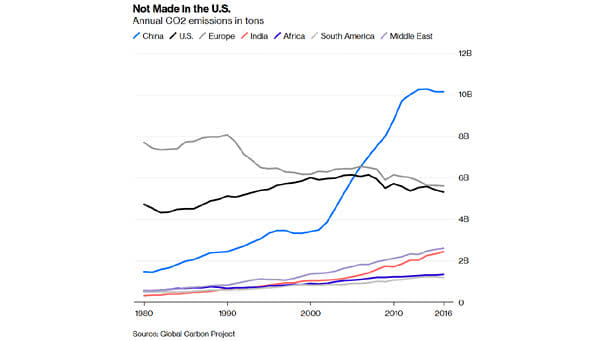
Annual Carbon Emissions in Tons (CO2) About 86% of global carbon emissions are produced by countries other than the United States. You may also like “Total Global Carbon Emissions.” Image: Bloomberg
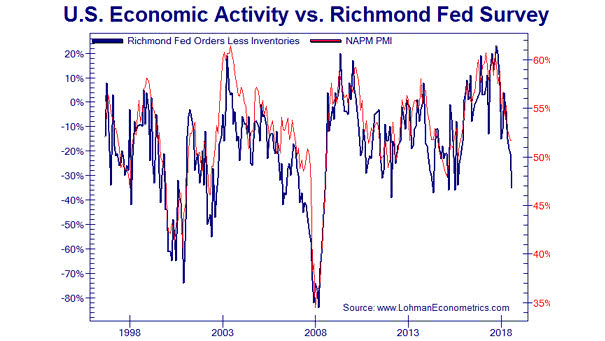
ISM Manufacturing Index vs. Richmond Fed Survey The Richmond Fed survey suggests that the ISM Manufacturing Index could plunge to 45, but the Empire State Manufacturing Survey is a better predictor over the past two years. Image: Lohman Econometrics
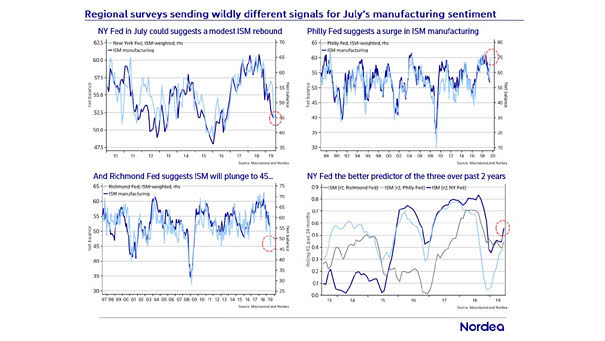
ISM Manufacturing Index vs. Predictors The chart shows that the Empire State Manufacturing Survey is a better predictor of the ISM Manufacturing Index over the past two years. Image: Nordea and Macrobond
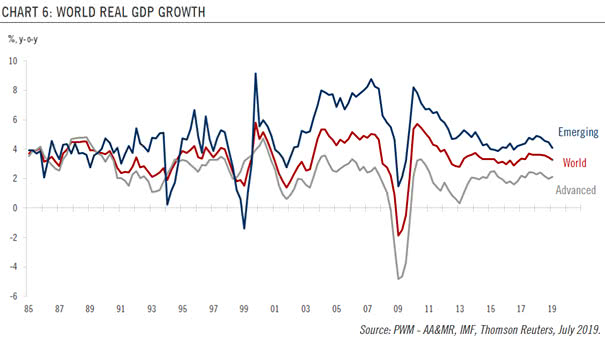
World Real GDP Growth The chart shows the world real GDP growth since 1985. Without a rebound, the world real GDP growth could be 3.1% this year. Image: Pictet Wealth Management
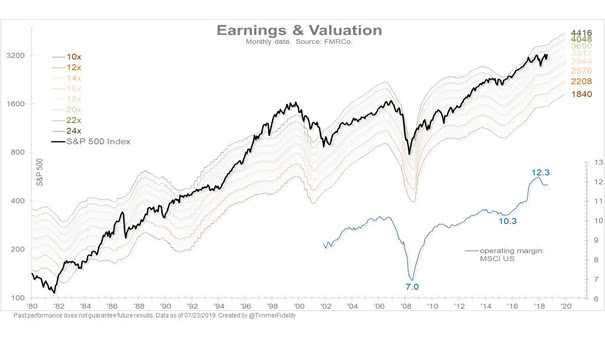
S&P 500 Index – Earnings & Valuation The S&P 500 valuation is high relative to history and the earnings growth estimate has fallen to +3.7% for 2019. You may also like our “Stock Market Valuation.” Image: Fidelity Investments
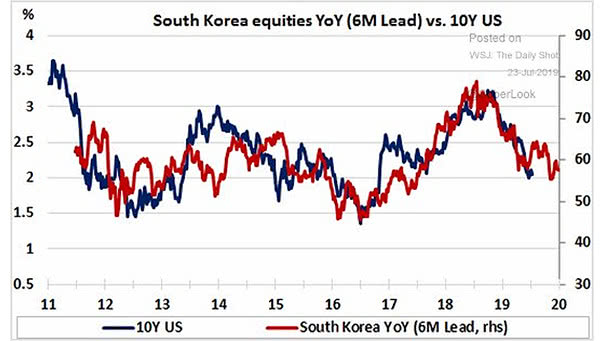
South Korea Equities Lead U.S. 10-Year Treasury Yield Interesting chart suggesting that South Korea equities YoY lead the U.S. 10-year Treasury yield by 6 months. Image: Rothko Research
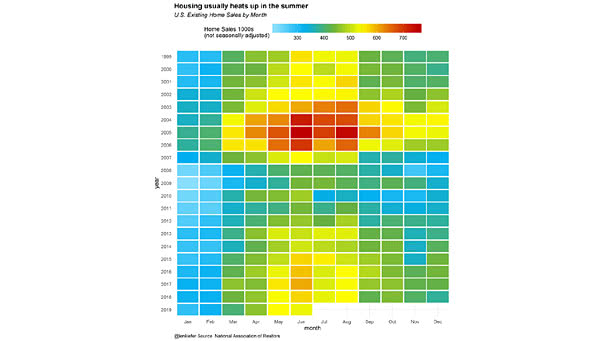
Housing Usually Heats Up in the Summer This great chart shows that U.S. home sales usually heats up in the summer. Image: Leonard Kiefer
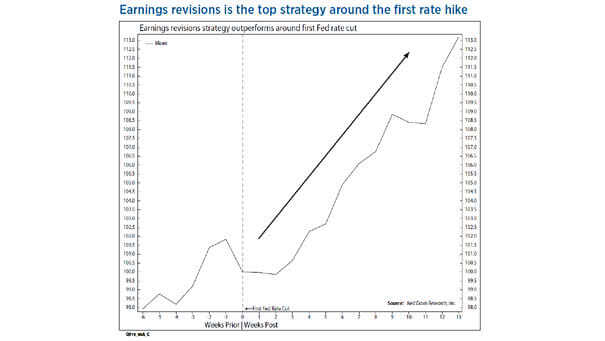
Earnings Revisions Strategy Outperforms Around First Fed Rate Cut Around first Fed rate cut, earnings revisions is the top factor out of 200 strategies. Image: Ned Davis Research
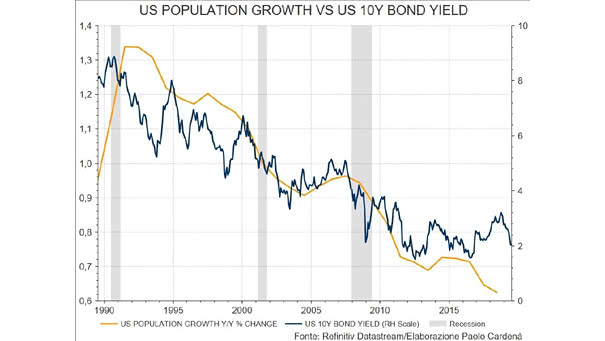
U.S. Population Growth vs. U.S. 10-Year Treasury Bond Yield U.S. demographics explain the 10-year Treasury bond yield, due to low inflation. The U.S. 10-year bond yield reflects inflation and growth expectations, and working age population growth contributes to inflation and GDP growth. Image: Paolo Cardena
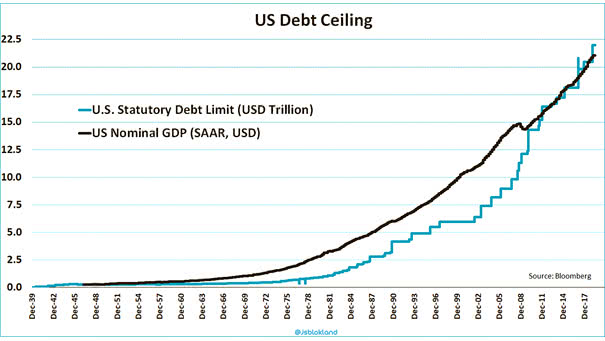
U.S. Debt Ceiling and U.S. Nominal GDP The statutory debt limit, also called the debt ceiling, is the statutory maximum of money the U.S. Treasury is allowed to borrow.Now, it is higher than U.S. nominal GDP. Image: Jeroen Blokland